一.基本命令:
plot(); 绘图命令
hold on,hold off 清除之前的图形
legend();多图标注
xlabel();
ylabel();
zlable();
title();
text();文本
annotation();用于在图上绘制符号
关于图像字体和轴的设置命令
二.命令介绍
2.1
plot(); 绘图命令
%hold on,hold off 清除之前的图形
%plot(x,y)
%plot(y),x=1,2,3,4...
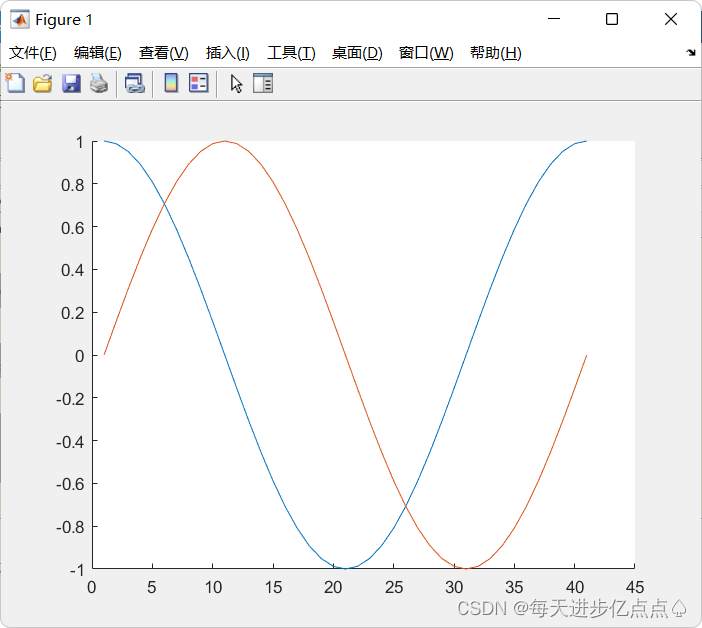
hold on
plot(cos(0:pi/20:2*pi));
plot(sin(0:pi/20:2*pi));
hold off
输出结果为
2.2 legend();多图标注
xlabel();
ylabel();
title();
%legend() 图标
%xlabel
%ylabel
%title
%zlable
%hold on
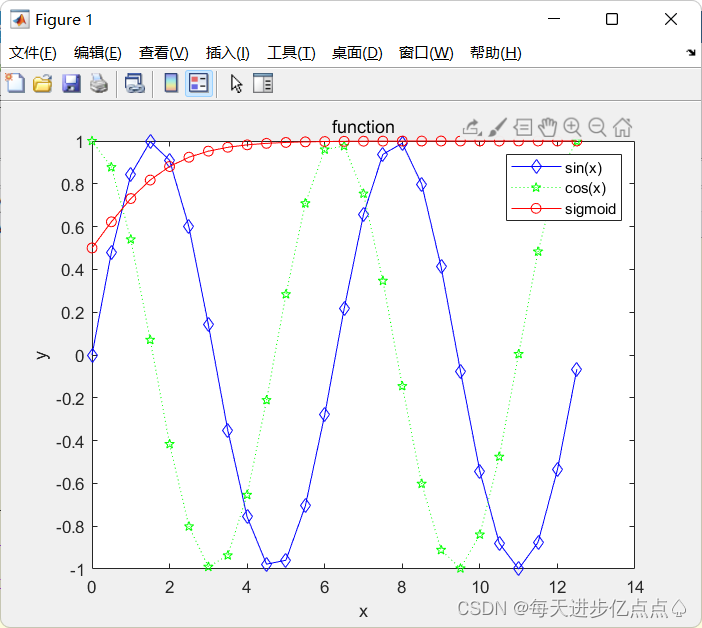
x=0:0.5:4*pi;
y=sin(x);
h=cos(x);
w=1./(1+exp(-x));
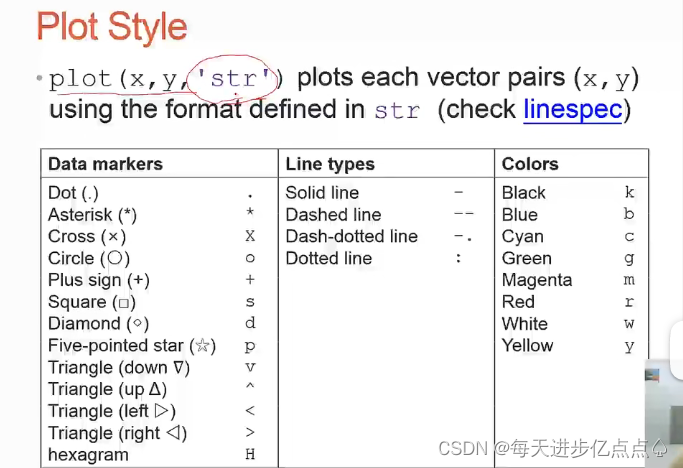
plot(x,y,'bd-',x,h,'gp:',x,w,'ro-');
legend('sin(x)','cos(x)','sigmoid');
xlabel('x');
ylabel('y');
title('function');
%hold off
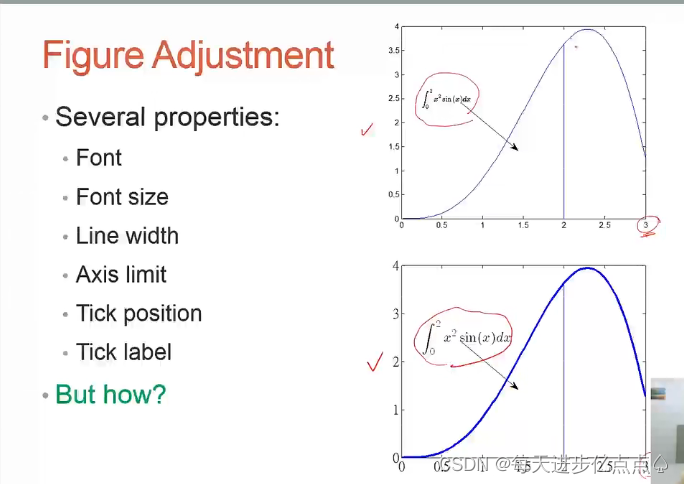
2.3text();文本
annotation();用于在图上绘制符号
%text();
%annotation();
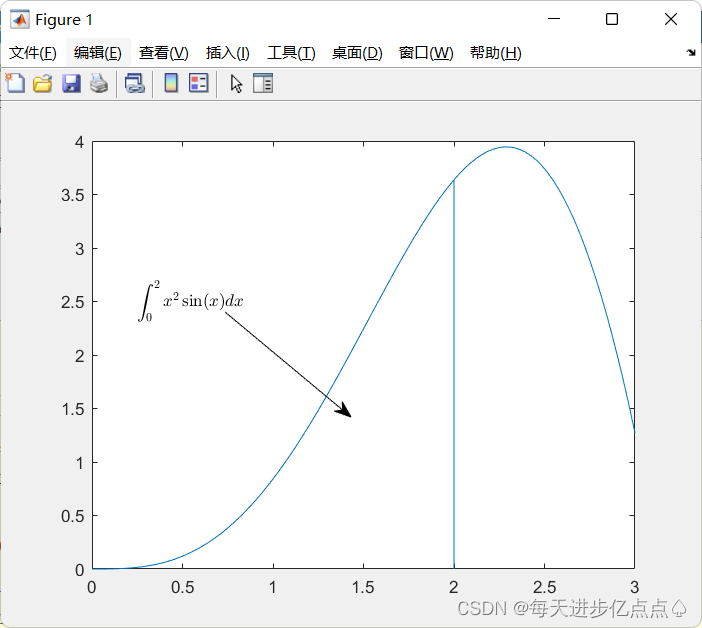
x=linspace(0,3);
y=x.^2.*sin(x);
plot(x,y);
line([2,2],[0,2^2*sin(2)]);
str='$$ \int_{0}^{2} x^2\sin(x) dx $$';
%'Interpreter','latex'只用latex的符号
text(0.25,2.5,str,'Interpreter','latex');
annotation('arrow','X',[0.32,0.5],'Y',[0.6,0.4]);
三. 图像字体和轴的设置命令
%%
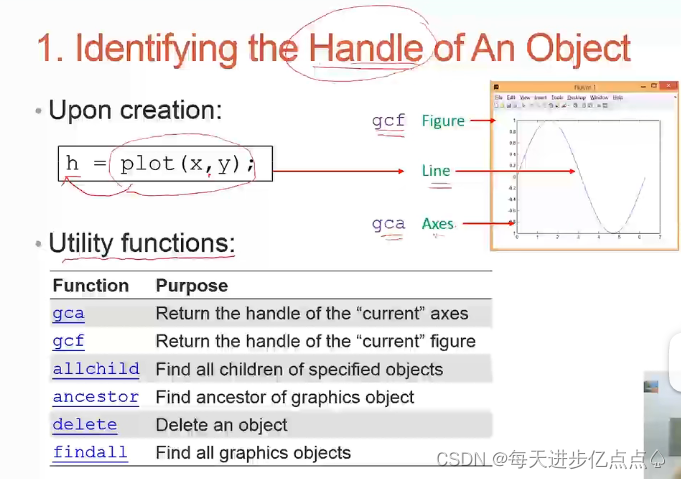
%gca、gcf是专门针对Figure和Axes的指令,如果针对Line,则需要定义h=plot(x,y)
%get()用来获取特征;
%set()用来设置特征;
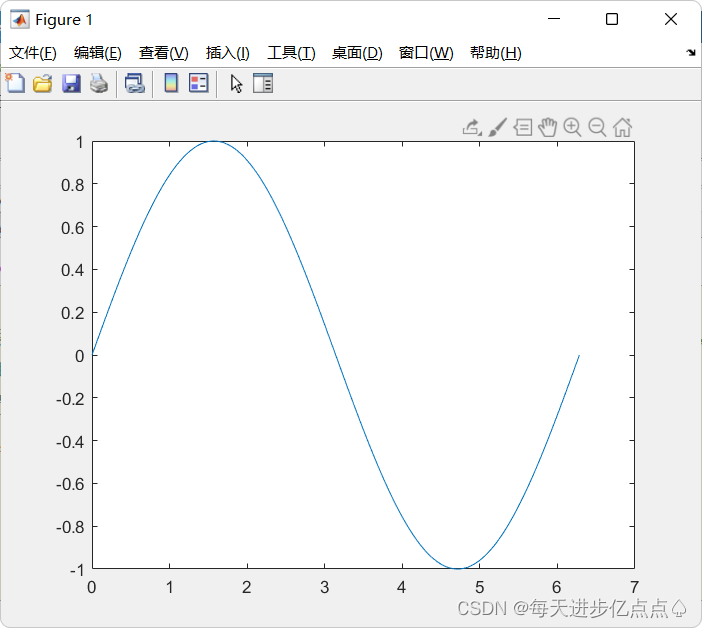
x=linspace(0,2*pi,1000);
y=sin(x);
plot(x,y);
h=plot(x,y);
get(h)
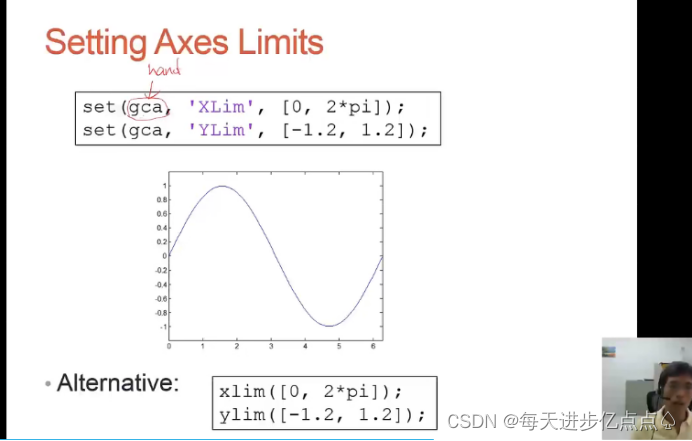
%set axes limits设置坐标的最大最小值
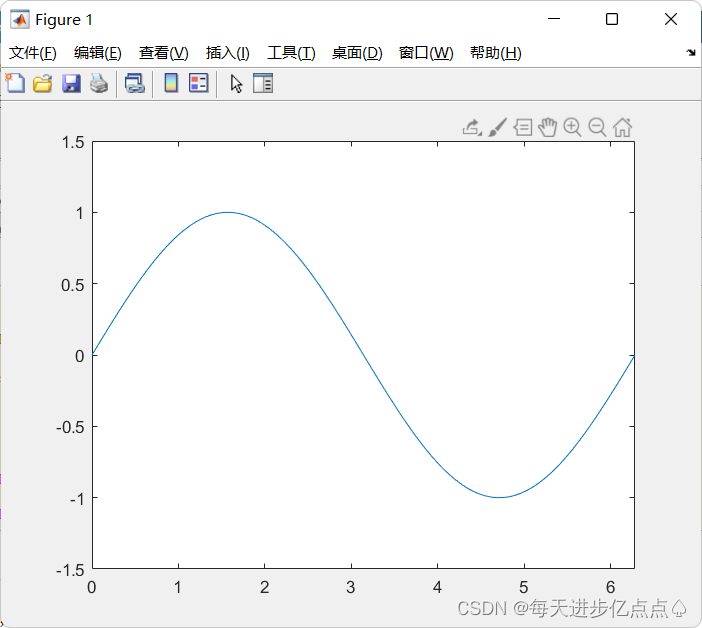
x=linspace(0,2*pi,1000);
y=sin(x);
plot(x,y);
set(gca,'XLim',[0,2*pi]);%xlim([0,2*pi]);
set(gca,'YLim',[-1.5,1.5]);%ylim([-1.5,1.5]);%setting font and tick of axes设置轴的字体和刻度
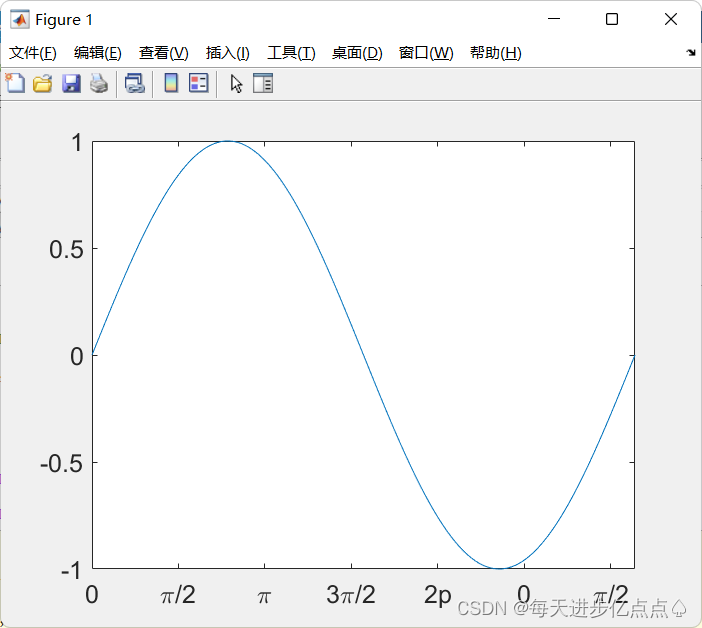
x=linspace(0,2*pi,1000);
y=sin(x);
plot(x,y)
set(gca,'FontSize',15);%轴的字体设置
%set(gca,'XTick',0:pi/2:2*pi);%设置轴的刻度
set(gca,'XTickLabel',0:90:360);
%set(gca,'FontName','symbol');
set(gca,'XTickLabel',{'0','\pi/2','\pi','3\pi/2','2p'});
%%
x=0:pi/100:2*pi;
plot(x,sin(x));
set(gca,'xtick',[ 0 0.5*pi pi 1.5*pi 2*pi]);
xticklabels({'0','0.5\pi','\pi','1.5\pi','2\pi'})%%
%Multiple Figure
x=-10:0.1:10;
y1=x.^2-8;
y2=exp(x);
figure,plot(x,y1);
figure,plot(x,y2);
%figure position and size
%figure('Position',[left,bottom,width,height]);
figure('Position',[2,2,2,2]);
%%
%several plots in one figure ,subplot(m.n,t)
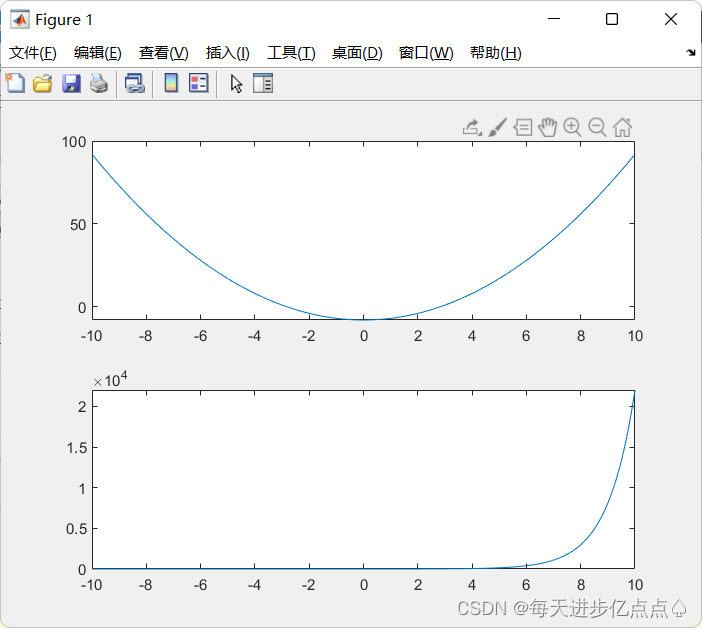
x=-10:0.1:10;
y1=x.^2-8;
y2=exp(x);
subplot(2,1,1);
plot(x,y1);
subplot(2,1,2);
plot(x,y2);四.参考ppt
今天的文章matlab基本绘图方法_matlab软件介绍分享到此就结束了,感谢您的阅读。
版权声明:本文内容由互联网用户自发贡献,该文观点仅代表作者本人。本站仅提供信息存储空间服务,不拥有所有权,不承担相关法律责任。如发现本站有涉嫌侵权/违法违规的内容, 请发送邮件至 举报,一经查实,本站将立刻删除。
如需转载请保留出处:http://bianchenghao.cn/77056.html

