1 数据处理(一):python二维插值运算
1.1 前言
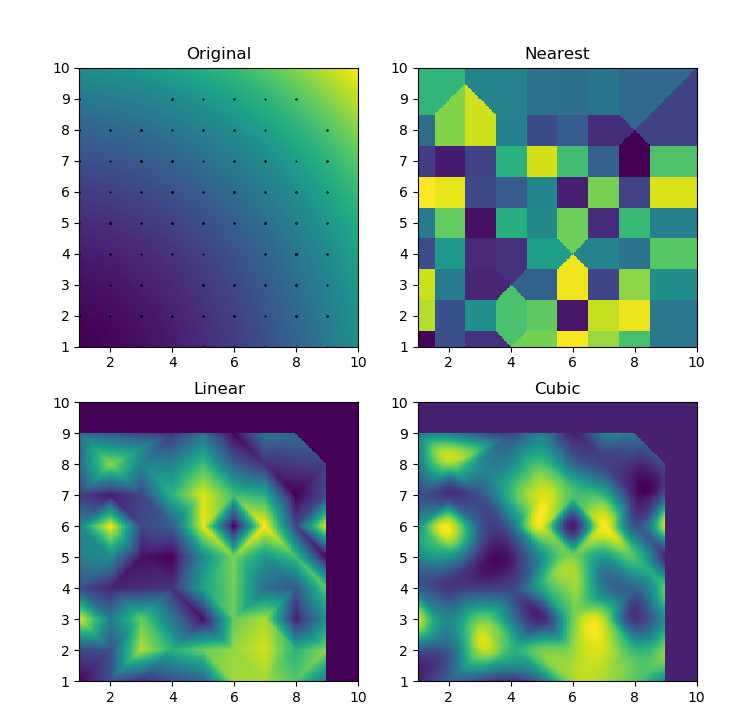
结果展示:黑色的点是前期输入生成的,彩色是后期生成的,代表不同像素点的数值
import numpy as np
import matplotlib.pyplot as plt
from scipy.interpolate import interp1d #引入scipy中的一维插值库
from scipy.interpolate import griddata#引入scipy中的二维插值库

x = np.linspace(0, 10, num=11, endpoint=True)
y = np.cos(-x**2/9.0)
f = interp1d(x, y)
f2 = interp1d(x, y, kind='cubic')

xnew = np.linspace(0, 10, num=41, endpoint=True)

plt.plot(x, y, 'o', xnew, f(xnew), '-', xnew, f2(xnew), '--')
plt.legend(['data', 'linear', 'cubic'], loc='best')
plt.show()
'''''
def func(x, y):
    return x**2+y**2
'''''
grid_x, grid_y = np.mgrid[1:10:200j, 1:10:500j]
#x方向在0-1上均匀生成200个数,y方向在0-1上均匀生成500个数

points = np.random.randint(1,10,(200, 2))
#随机生成(200,2)的矩阵,即200个点坐标

values = np.arange(0,200)#func(points[:,0], points[:,1])
#规定坐标值的值


grid_z0 = griddata(points, values, (grid_x, grid_y), method='nearest')
print(grid_z0[0][1])
#由于griddata返回的值是nddarry的格式的,所以可以读取他的数据,这里就是读取第[0][1]个数值的数

grid_z1 = griddata(points, values, (grid_x, grid_y), method='linear',fill_value=5)
print(grid_z1[0][1])

grid_z2 = griddata(points, values, (grid_x, grid_y), method='cubic',fill_value=5)
print(grid_z1[0][1])
'''
plt.subplot(221)
plt.imshow(func(grid_x, grid_y).T, extent=(1,10,1,10), origin='lower')
plt.plot(points[:,0], points[:,1], 'k.', ms=1)

plt.title('Original')
'''
plt.subplot(222)
plt.imshow(grid_z0.T, extent=(1,10,1,10), origin='lower')

plt.title('Nearest')
plt.subplot(223)
plt.imshow(grid_z1.T, extent=(1,10,1,10), origin='lower')

plt.title('Linear')
plt.subplot(224)
plt.imshow(grid_z2.T, extent=(1,10,1,10), origin='lower')

plt.title('Cubic')
plt.gcf().set_size_inches(8, 8)
plt.show()
1.2 解释
python中:
scipy.interpolate.griddata(points,values,xi,method =‘linear’,fill_value = nan,rescale = False )
参数:
points:数据点坐标。可以是形状(n,D)的数组,也可以是ndim数组的元组。(已知点)
values:浮点或复数的ndarray,形状(n,)的数据值。(已知点对应的值)
xi : 浮点数的二维数组或一维数组的元组,形状(M,D)插值数据的点。(被划分后的网格)
method:‘linear’,‘nearest’,‘cubic’,可选其中的插值方法之一。(插值方式)
{
nearest 返回最接近插值点的数据点的值。
linear 将输入点设置为n维单纯形,并在每个单形上线性插值。
cubic (1-d) 返回由三次样条确定的值。
cubic (2-d) 返回由分段立方,连续可微(C1)和近似曲率最小化多项式表面确定的值。
}
fill_value : float,可选。用于填充输入点凸包外部的请求点的值。如果未提供,则默认为nan。此选项对“最近”方法无效。
rescale : bool,可选。在执行插值之前,重新缩放指向单位立方体。如果某些输入维度具有不可比较的单位并且相差很多个数量级,则这非常有用。
返回值:nddarry 内插值数组
1.3 优化(未完待续)
import numpy as np
import matplotlib.pyplot as plt
#from scipy.interpolate import interp1d #引入scipy中的一维插值库
from scipy.interpolate import griddata#引入scipy中的二维插值库

four_boundary_point_original = np.array([[1,0],
                                [10,2],
                                [0,5],
                                [9,10]])
four_boundary_point_x = four_boundary_point_original.min(axis=0)
four_boundary_point_y = four_boundary_point_original.max(axis=0)
four_boundary_point = np.concatenate([four_boundary_point_x,four_boundary_point_y])
print(four_boundary_point)

'''
for i in range(4):
    input_x = float(input('please input 4 number:'))
    four_boundary_point.append(input_x)
'''
#four_boundary_point = [0,10,0,10]

mesh_size_x = round((four_boundary_point[2] - four_boundary_point[0])/0.05)
mesh_size_y = round((four_boundary_point[3] - four_boundary_point[1])/0.05)
print(mesh_size_y,mesh_size_x)
#将小格子的x方向分为步长为0.05的长度

def func(x, y):
    return x**2+y**2

x = np.linspace(four_boundary_point[0],four_boundary_point[2],mesh_size_x)
y = np.linspace(four_boundary_point[1],four_boundary_point[3],mesh_size_y)
grid_x, grid_y = np.meshgrid(x,y)
#x方向在0-1上均匀生成200个数,y方向在0-1上均匀生成mesh_size个数字

points = 10 * np.random.random((200,2))
#随机生成(200,2)的矩阵,即200个点坐标

values = np.arange(0,200)
#规定坐标值的值

grid_z0 = griddata(points, values, (grid_x, grid_y), method='nearest')
#print(grid_z0)
grid_z0[grid_z0<80]=0

grid_z0[(grid_z0>=80)&(grid_z0<160)]=50
grid_z0[(grid_z0>=160)&(grid_z0<=200)]=100
#由于griddata返回的值是nddarry的格式的,所以可以读取他的数据,这里就是读取第[0][1]个数值的数

grid_z1 = griddata(points, values, (grid_x, grid_y), method='linear',fill_value=5)

grid_z1[grid_z1<80] = 1
grid_z1[(grid_z1>=80)&(grid_z1<160)] = 50
grid_z1[(grid_z1>=160)&(grid_z1<=200)] = 100

grid_z2 = griddata(points, values, (grid_x, grid_y), method='cubic',fill_value=5)


grid_z2[grid_z2<80] = 1
grid_z2[(grid_z2>=80)&(grid_z2<160)] = 50
grid_z2[(grid_z2>=160)&(grid_z2<=200)] = 100

plt.subplot(221)
plt.imshow(grid_z0.T, extent=(0,10,0,10), origin='lower')
plt.plot(points[:,0], points[:,1], 'k.', ms=1)
plt.title('Nearest')

plt.subplot(222)
plt.imshow(grid_z1.T, extent=(0,10,0,10), origin='lower')
plt.plot(points[:,0], points[:,1], 'k.', ms=1)
plt.title('Linear')

plt.subplot(223)
plt.imshow(grid_z2.T, extent=(0,10,0,10), origin='lower')
plt.plot(points[:,0], points[:,1], 'k.', ms=1)
plt.title('Cubic')

plt.gcf().set_size_inches(8, 8)
plt.show()

#输入坐标点得到值
while True:
    point_wanted = []#[5.8,7.2]
    for i in range(2):
        point_wanted_input = float(input('please input the point you want'))
        point_wanted.append(point_wanted_input)

    point_wanted_x = int(round((point_wanted[0] - four_boundary_point[0])
                               /((four_boundary_point[2]-four_boundary_point[0])/mesh_size_x)))
    point_wanted_y = int(round((point_wanted[1] - four_boundary_point[1])
                               /((four_boundary_point[3]-four_boundary_point[1])/mesh_size_y)))
    #将输入的点进行四舍五入得到对应的array数组的值,(x点坐标-x左边界)/((x左边界-x右边界)/分成的小格子)
    print(point_wanted_x,point_wanted_y)
    print(grid_z1[point_wanted_x][point_wanted_y])
2 python处理二维插值时与matlab速度比较
python处理二维插值时,相较与matlab速度很慢
fun=interpolate.interp2d(x,y,z,kind=’cubic’);
我有一个66 x 241的矩阵z,分别对应(x,y)的取值,而x和y都分别是等间距的。
这个时候差值需要等上十多分钟。
而用matlab
fun_d=interp2(x,y,z,x1,y1,’cubic’);
则需要0.1s时间不到
这个和底层的实现有关,matlab实现技术和python不一样, 所以速度差别很大,可以尝试一下用哈希表
我自己的判断是,有输入输出看,pathon给出了整个的插值表达式,而matlab是根据那个选择的点往附近几个点进行插值。即python的个数越多,表达式计算的复杂度会增加的很快,而matlab不管你原始矩阵多大,判断选取点的位置后只对上下左右比如3*3的矩阵进行插值,不知道猜想对不对。。。
python处理二维插值时,相较与matlab速度很慢-编程语言-CSDN问答
版权声明:本文内容由互联网用户自发贡献,该文观点仅代表作者本人。本站仅提供信息存储空间服务,不拥有所有权,不承担相关法律责任。如发现本站有涉嫌侵权/违法违规的内容, 请发送邮件至 举报,一经查实,本站将立刻删除。
如需转载请保留出处:https://bianchenghao.cn/35989.html

