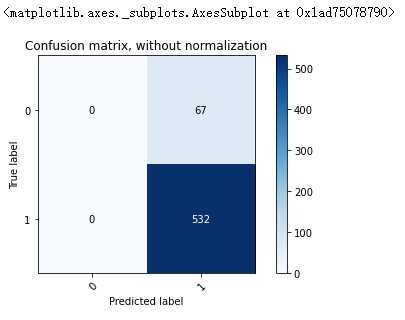
Python实现混淆矩阵
废话少说,直接上干货:
from sklearn.utils.multiclass import unique_labels
from sklearn.metrics import confusion_matrix
import matplotlib.pyplot as plt

# y_test为真实label,y_pred为预测label,classes为类别名称,是个ndarray数组,内容为string类型的标签
class_names = np.array(["0","1"]) #按你的实际需要修改名称
plot_confusion_matrix(y_test, y_pred, classes=class_names, normalize=False)
plot_confusion_matrix函数的具体实现如下,直接复制粘贴到你的代码中即可!
求各位看官老爷点个赞!
def plot_confusion_matrix(y_true, y_pred, classes,
                          normalize=False,
                          title=None,
                          cmap=plt.cm.Blues):
    """ This function prints and plots the confusion matrix. Normalization can be applied by setting `normalize=True`. """
    if not title:
        if normalize:
            title = 'Normalized confusion matrix'
        else:
            title = 'Confusion matrix, without normalization'

    # Compute confusion matrix
    cm = confusion_matrix(y_true, y_pred)
    # Only use the labels that appear in the data
    classes = classes[unique_labels(y_true, y_pred)]
    if normalize:
        cm = cm.astype('float') / cm.sum(axis=1)[:, np.newaxis]
        #print("Normalized confusion matrix")
    else:
        pass
        #print('Confusion matrix, without normalization')

    #print(cm)

    fig, ax = plt.subplots()
    im = ax.imshow(cm, interpolation='nearest', cmap=cmap)
    ax.figure.colorbar(im, ax=ax)
    # We want to show all ticks...
    ax.set(xticks=np.arange(cm.shape[1]),
           yticks=np.arange(cm.shape[0]),
           # ... and label them with the respective list entries
           xticklabels=classes, yticklabels=classes,
           title=title,
           ylabel='True label',
           xlabel='Predicted label')

    ax.set_ylim(len(classes)-0.5, -0.5)

    # Rotate the tick labels and set their alignment.
    plt.setp(ax.get_xticklabels(), rotation=45, ha="right",
             rotation_mode="anchor")

    # Loop over data dimensions and create text annotations.
    fmt = '.2f' if normalize else 'd'
    thresh = cm.max() / 2.
    for i in range(cm.shape[0]):
        for j in range(cm.shape[1]):
            ax.text(j, i, format(cm[i, j], fmt),
                    ha="center", va="center",
                    color="white" if cm[i, j] > thresh else "black")
    fig.tight_layout()
    return ax
版权声明:本文内容由互联网用户自发贡献,该文观点仅代表作者本人。本站仅提供信息存储空间服务,不拥有所有权,不承担相关法律责任。如发现本站有涉嫌侵权/违法违规的内容, 请发送邮件至 举报,一经查实,本站将立刻删除。
如需转载请保留出处:https://bianchenghao.cn/38257.html

