Section #5. Tracing
Tracing provides insight into behavioral problems that manifest during interactions between different code modules. A common way to obtain execution traces is by using printks. Although printk is perhaps the most heavily used method for kernel debugging (there are more than 62,000 printk() statements in the 2.6.23 source tree), it is not sophisticated enough for high-volume tracing. Linux Trace Toolkit (LTT) is a powerful tool that lets you obtain complex system level traces with minimum overhead.
Tracing可以深入了解在不同代码模块之间的交互过程中出现的行为问题。获取执行跟踪的常用方法是使用printk。尽管printk可能是内核调试最常用的方法(2.6.23源代码树中有超过62,000个printk()语句),但它对于高容量tracing来说还不够复杂。 Linux Trace Toolkit(LTT)是一个功能强大的工具,可让您以最小的开销获取复杂的系统级tracing。
Linux Trace Toolkit
LTT extracts execution traces that are useful for postmortem analyses and is valuable in situations where it might not be possible to use a debugger. Unlike OProfile, which collects data by sampling events at regular intervals, LTT provides exact traces of events as and when they occur.
LTT提取对事后分析有用的执行跟踪,并且在可能无法使用调试器的情况下很有用。与通过定期抽样事件收集数据的OProfile不同,LTT会在事件发生时提供精确的事件跟踪。
LTT consists of four components: LTT由四部分组成:
• A core module that provides trace services to the rest of the kernel. The collected traces are copied to a kernel buffer. 一个核心模块,为内核的其余部分提供trace服务。收集的trace将复制到内核缓冲区。
• Code that makes use of the trace services. These are inserted at points where you want to capture trace dumps. 使用trace服务的代码。它们将插入您要捕获trace转储的位置。
• A trace daemon that pulls trace information from the kernel buffer to a permanent location in the filesystem. trace守护程序,它将trace信息从内核缓冲区提取到文件系统中的永久位置。
• Utilities such as tracereader and tracevisualizer that interpret raw trace data and convert it into human-readable form. If you are developing code for an embedded device having no GUI support, you can transparently run these tools on another machine. tracereader和tracevisualizer等实用程序,用于解释原始trace数据并将其转换为人类可读的形式。 如果您在为没有GUI支持的嵌入式设备开发代码,则可以在另一台计算机上透明地运行这些工具。
LTT is not part of the mainline kernel.[8] You might download LTT kernel patches, trace daemon, and user-space trace utilities from www.opersys.com/LTT. LTT不是主线内核的一部分。[8] 您可以从www.opersys.com/LTT下载LTT内核补丁,trace守护程序和用户空间trace实用程序。
[8] LTT was included as a release candidate in the 2.6.11-rc1-mm1 patch, downloadable from www.kernel.org.
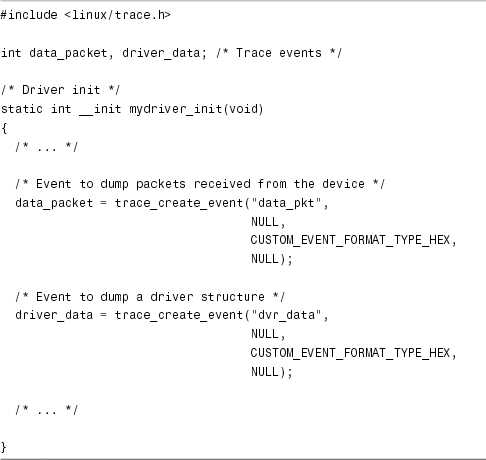
Let’s find out what LTT offers with the help of a simple example. Assume that you see data corruption when your application is reading from a device. You first want to figure out whether the device is sending bad data or whether a kernel layer is introducing the corruption. To do that, dump data packets and data structures at the device driver level. Listing 1.7 initializes the LTT events that you plan to generate. 让我们通过一个简单的例子找出LTT提供的功能。 假设在应用程序从设备读取数据时遇到数据损坏。您首先要弄清楚设备是否正在发送错误数据,或者内核层是否引入了损坏。为此,请在设备驱动程序级别转储数据包和数据结构。清单1.7初始化您计划生成的LTT事件。
Listing 1.7. Creating LTT Events

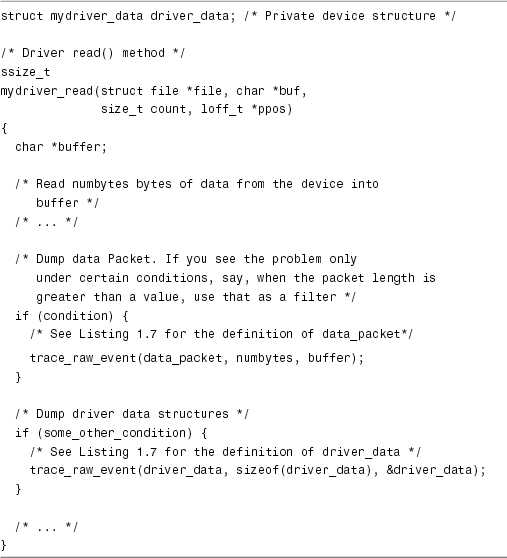
Next, let’s add trace hooks to dump received packets and data structures when the driver reads data from the device. This is done in Listing 1.8 in the driver read() method. 接下来,让我们添加trace钩子,便于在驱动程序从设备读取数据时转储接收的数据包和数据结构。这在清单1.8的驱动程序read()方法中完成。
Listing 1.8. Obtaining Trace Dumps

Compile and run this code as part of the kernel or as a module. Remember to turn on trace support in the kernel by setting CONFIG_TRACE while configuring the kernel. The next step is to start the trace daemon: 作为内核的一部分或作为模块编译并运行此代码。请记住在配置内核时通过设置CONFIG_TRACE来打开内核中的跟踪支持。下一步是启动跟踪守护程序:
bash> tracedaemon -ts60 /dev/tracer mylog.txt mylog.proc
/dev/tracer is the interface used by the trace daemon to access the trace buffer, -ts60 asks the daemon to run for 60 seconds, mylog.txt is the file where you want to store the generated raw trace, and mylog.proc is where you want to save the system state obtained from procfs. Later versions of LTT use a mechanism called relayfs rather than the /dev/tracer device for efficiently transferring data from the kernel trace buffer to user space. /dev/tracer是跟踪守护进程用来访问跟踪缓冲区的接口,-ts60要求守护进程运行60秒,mylog.txt是要存储生成的原始跟踪的文件,mylog.proc是您要保存从procfs获取的系统状态的位置。更高版本的LTT使用称为relayfs的机制而不是/dev/tracer设备来有效地将数据从内核跟踪缓冲区传输到用户空间。
Run your application that reads data from the device: 运行从设备读取数据的应用程序:
bash> ./application → Trigger invocation of mydriver_read()
mylog.txt should now contain the requested trace data. The generated raw trace can be analyzed using the tracevisualizer tool. Choose the Custom Events option and search for data_pkt and dvr_data events. The output looks like this:
mylog.txt现在应该包含请求的跟踪数据。可以使用tracevisualizer工具分析生成的原始跟踪。选择“自定义事件”选项并搜索data_pkt和dvr_data事件。输出如下所示:

The last column holds the trace data. The timestamp shows the instant when the trace was collected. If the data looks corrupt, the device could be sending bad data. Otherwise, the problem must be in a higher kernel layer and can be further isolated by obtaining traces from a different point in the data-flow path.
最后一列保存跟踪数据。时间戳显示收集跟踪的时间。如果数据看起来已损坏,则设备可能正在发送错误数据。否则,问题应该在更高的内核层中,并且可以通过从数据流路径中的不同点获得跟踪来进一步隔离。
The next generation of LTT called LTTng is available for download from http://ltt.polymtl.ca/. This project also includes a post-trace analyzer called Linux Trace Toolkit Viewer (LTTV).
LTTng是下一代LTT,可从http://ltt.polymtl.ca/下载。该项目还包括一个名为Linux Trace Toolkit Viewer(LTTV)的跟踪分析器。
If your need is only to perform limited tracing of a user application, you can use the strace utility rather than LTT. Strace uses the ptrace support in the kernel to intercept system calls. It prints out a list of system calls made by your application, along with the corresponding arguments and return values.
如果您只需要对用户应用程序执行有限的跟踪,则可以使用strace实用程序而不是LTT。 Strace使用内核中的ptrace支持来拦截系统调用。它打印出应用程序发出的系统调用列表,以及相应的参数和返回值。
今天的文章Tracing_Tracing电竞椅「建议收藏」分享到此就结束了,感谢您的阅读。
版权声明:本文内容由互联网用户自发贡献,该文观点仅代表作者本人。本站仅提供信息存储空间服务,不拥有所有权,不承担相关法律责任。如发现本站有涉嫌侵权/违法违规的内容, 请发送邮件至 举报,一经查实,本站将立刻删除。
如需转载请保留出处:https://bianchenghao.cn/69925.html
