
Backtrader 文档学习- Plotting -Plotting on the same axis
1.概述
在同一轴上绘图,绘图是在同一空间上绘制原始数据和稍微(随机)修改的数据,但不是在同一轴上。
核心代码,data数据正负50点。
# The filter which changes the close price def close_changer(data, *args, kwargs): data.close[0] += 50.0 * random.randint(-1, 1) return False # length of stream is unchanged 图示 :
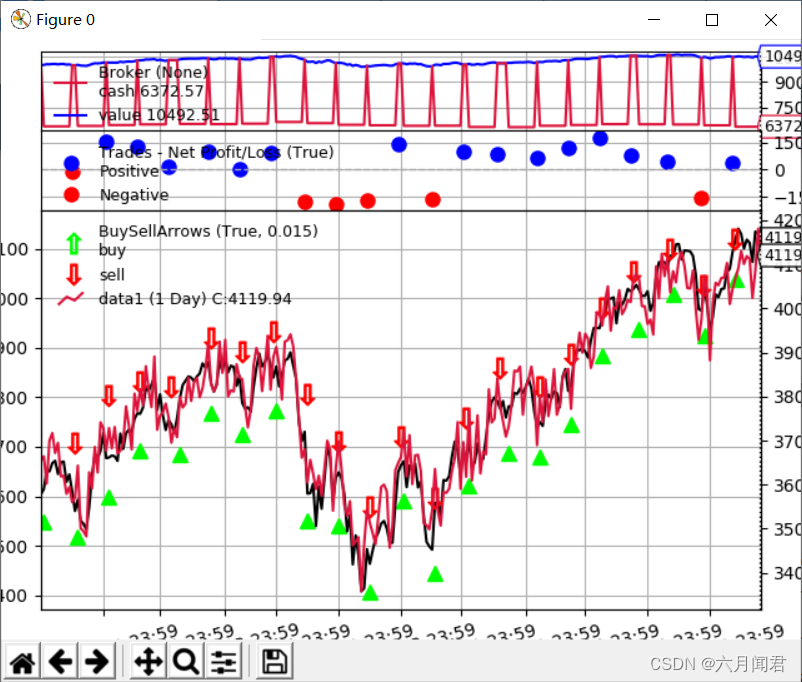
可以看到:
- 图表的左右两侧有不同的刻度
- 当看到摆动的红线(随机数据)时,这一点最为明显,它在原始数据周围振荡±50个点。
在图上,视觉印象是这些随机数据大多时候都在原始数据上方,这只是由于左右不同的刻度造成的视觉差异。
import backtrader as bt cerebro = bt.Cerebro() data0 = bt.feeds.MyFavouriteDataFeed(dataname='futurename') cerebro.adddata(data0) data1 = bt.feeds.MyFavouriteDataFeed(dataname='spotname') data1.compensate(data0) # let the system know ops on data1 affect data0 data1.plotinfo.plotmaster = data0 data1.plotinfo.sameaxis = True cerebro.adddata(data1) ... cerebro.run() data1 获得了一些plotinfo 值:
- 在与数据0相同的空间上绘制
- 获得使用相同轴sameaxis的设置
python ./future-spot.py --sameaxis 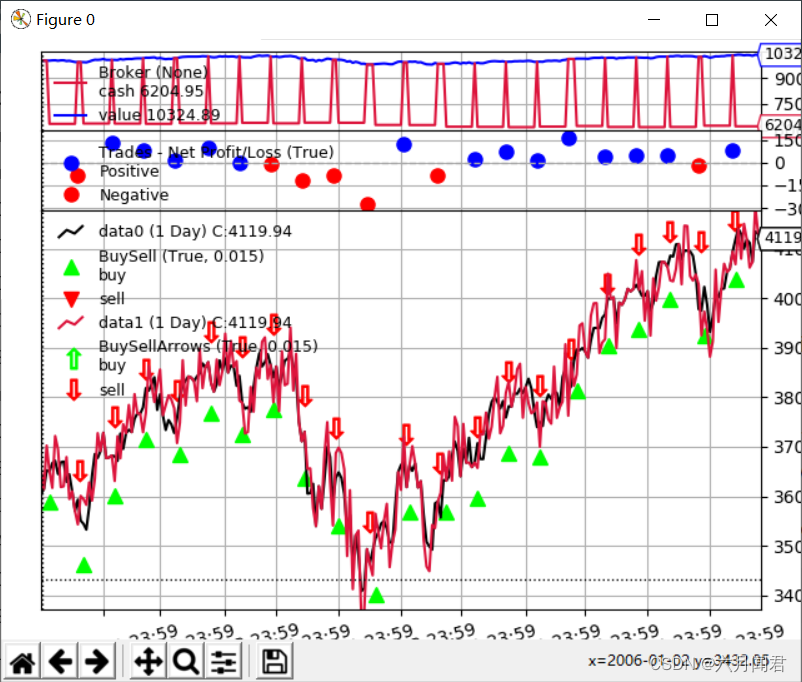
注意:
- 右侧只有一个刻度
- 现在随机数据似乎明显在原始数据周围振荡,预期的视觉效果。对比上图更准确。
2.Help
python ./future-spot.py --help usage: future-spot.py [-h] [--no-comp] [--sameaxis] Compensation example optional arguments: -h, --help show this help message and exit --no-comp --sameaxis 3.代码
#!/usr/bin/env python # -*- coding: utf-8; py-indent-offset:4 -*- # # Copyright (C) 2015-2023 Daniel Rodriguez # # This program is free software: you can redistribute it and/or modify # it under the terms of the GNU General Public License as published by # the Free Software Foundation, either version 3 of the License, or # (at your option) any later version. # # This program is distributed in the hope that it will be useful, # but WITHOUT ANY WARRANTY; without even the implied warranty of # MERCHANTABILITY or FITNESS FOR A PARTICULAR PURPOSE. See the # GNU General Public License for more details. # # You should have received a copy of the GNU General Public License # along with this program. If not, see <http://www.gnu.org/licenses/>. # from __future__ import (absolute_import, division, print_function, unicode_literals) import argparse import random import backtrader as bt # The filter which changes the close price def close_changer(data, *args, kwargs): data.close[0] += 50.0 * random.randint(-1, 1) return False # length of stream is unchanged # override the standard markers class BuySellArrows(bt.observers.BuySell): plotlines = dict(buy=dict(marker='$\u21E7$', markersize=12.0), sell=dict(marker='$\u21E9$', markersize=12.0)) class St(bt.Strategy): def __init__(self): bt.obs.BuySell(self.data0, barplot=True) # done here for BuySellArrows(self.data1, barplot=True) # different markers per data def next(self): if not self.position: if random.randint(0, 1): self.buy(data=self.data0) self.entered = len(self) else: # in the market if (len(self) - self.entered) >= 10: self.sell(data=self.data1) def runstrat(args=None): args = parse_args(args) cerebro = bt.Cerebro() dataname = './datas/2006-day-001.txt' # data feed data0 = bt.feeds.BacktraderCSVData(dataname=dataname, name='data0') cerebro.adddata(data0) data1 = bt.feeds.BacktraderCSVData(dataname=dataname, name='data1') data1.addfilter(close_changer) if not args.no_comp: data1.compensate(data0) data1.plotinfo.plotmaster = data0 if args.sameaxis: data1.plotinfo.sameaxis = True cerebro.adddata(data1) cerebro.addstrategy(St) # sample strategy cerebro.addobserver(bt.obs.Broker) # removed below with stdstats=False cerebro.addobserver(bt.obs.Trades) # removed below with stdstats=False cerebro.broker.set_coc(True) cerebro.run(stdstats=False) # execute cerebro.plot(volume=False) # and plot def parse_args(pargs=None): parser = argparse.ArgumentParser( formatter_class=argparse.ArgumentDefaultsHelpFormatter, description=('Compensation example')) parser.add_argument('--no-comp', required=False, action='store_true') parser.add_argument('--sameaxis', required=False, action='store_true') return parser.parse_args(pargs) if __name__ == '__main__': runstrat() - Commissions: Stocks vs Futures 佣金:股票与期货 ,对于策略并非BT核心 。
- Live Data Feeds and Live Trading 实时数据加载和实时交易,用不上。
偷个懒,不写了 。
算是在春节前完毕。
旧岁千般皆如意,新年万事定称心
新年快乐!
今天的文章 Backtrader 文档学习- Plotting -Plotting on the same axis分享到此就结束了,感谢您的阅读。
版权声明:本文内容由互联网用户自发贡献,该文观点仅代表作者本人。本站仅提供信息存储空间服务,不拥有所有权,不承担相关法律责任。如发现本站有涉嫌侵权/违法违规的内容, 请发送邮件至 举报,一经查实,本站将立刻删除。
如需转载请保留出处:https://bianchenghao.cn/bian-cheng-ji-chu/103450.html