
目录
3.5.1 基于事件的触发来修改值,比如每访问1次/api就增1
3.5.2 基于时间周期的触发来修改值,比如下面的示例中,是每间隔1秒获取cpu负载指标
3.5.3 基于每访问一次获取指标的URI才修改值,比如每次访问/metrics才去修改某些指标的值
1 概述
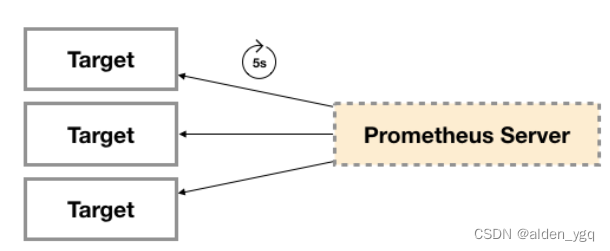
从广义的层面上讲,任何遵循Prometheus数据格式 ,可对其提供监控指标的程序都可以称为Exporter。在Prometheus社区中提供了丰富多样的Exporter供选择,如前面用到的node_exporter。
这些Exporter不仅类型丰富,功能上也很强大,通过合理的使用可以极大的方便我们的运维监控工作。除此之外,Prometheus还提供了支持多种开发语言的Clinet Libraries,用于满足Exporter的定制化开发需求。
1.1 Exporter运行方式
1.1.1 独立运行
以前面使用过的node_exporter为例,由于操作系统本身并不直接支持Prometheus,因此,只能通过一个独立运行的程序,从操作系统提供的相关接口将系统的状态参数转换为可供Prometheus读取的监控指标。
除了操作系统外,如Mysql、kafka、Redis等介质,都是通过这种方式实现的。这类Exporter承担了一个中间代理的角色。
1.1.2 应用集成
由于Prometheus项目的火热,目前有部分开源产品直接在代码层面使用Prometheus的Client Library,提供了在监控上的直接支持,如kubernetes、ETCD等产品。
这类产品自身提供对应的metrics接口,Prometheus可通过接口直接获取相关的系统指标数据。这种方式打破了监控的界限,应用程序本身做为一个Exporter提供功能。
2 常用的Exporter
| 类型 |
监控介质 |
Exporter |
|---|---|---|
| 数据库 |
Mysql |
MySQL server exporter |
| Elasticsearch |
Elasticsearch exporter |
|
| Mongodb |
MongoDB exporter |
|
| Redis |
Redis exporter |
|
| PostgreSQL |
PostgreSQL exporter |
|
| 硬件/操作系统 |
主机/Linux |
Node exporter |
| GPU |
NVIDIA GPU exporter |
|
| Windows |
Windows exporter |
|
| IPMI |
IPMI exporter |
|
| 网络设备 |
SNMP exporter |
|
| 消息队列 |
RabbitMQ |
RabbitMQ exporter |
| Kafka |
Kafka exporter |
|
| RocketMQ |
RocketMQ exporter |
|
| HTTP |
Apache |
Apache exporter |
| HAProxy |
HAProxy exporter |
|
| Nginx |
Nginx exporter |
|
| 云平台 |
阿里云 |
Alibaba Cloudmonitor exporter |
| AWS |
AWS CloudWatch exporter |
|
| Azure |
Azure Monitor exporter |
|
| 华为云 |
Huawei Cloudeye exporter |
|
| 腾讯云 |
TencentCloud monitor exporter |
|
| 其他 |
探针检测 |
Blackbox exporter |
| 容器 |
cArdviso |
|
| SSH |
SSH exporter |
更多export见:https://prometheus.io/docs/instrumenting/exporters/
3 自定义export
尽管Promethesu社区提供了丰富多样的Exporter给用户使用,但业务特点,有时候可能无法在现有资源中找到合适的工具。对此,可以利用Prometheus的Clinet Libraries,开发符合实际需要的自定义Exporter。
Clinet Libraries支持的语言版本非常丰富,除了官方提供了Go、Java or Scala、Python和Ruby几种外,还有很多第三方开发的其他语言版本。
本文以go为例,演示Exporter的开发。
| 指标类型 | 类别 | 描述 | 可应用场景 |
|---|---|---|---|
| Counter | 计数类 | 使用在累计指标单调递增或递减情况下,只能在目标重启后自动归零 | 服务请求处理数量、已完成任务数量、错误数量 |
| Guage | 测量类 | 使用可增可减的的数据情况下 | 当前内存/CPU使用情况、并发请求数量 |
| Histogram | 直方图类 | 使用统计指标信息在不同区间内的统计数量 | 延迟时间、响应大小。例如:0-1秒内的延迟时间、、0-5秒内的延迟时间、例如0-1kb之内的响应大小、0-5kb之内的响应大小 |
| Summary | 摘要类 | 类似于直方图,在客户端对百分位进行统计 | 延迟时间、响应大小。例如:超过百分之多少的人要满足需求的话,需要多长时间完成。 |
3.1 Gauge指标类型
3.1.1 不带label的基本案例
package main import ( "net/http" "github.com/prometheus/client_golang/prometheus" "github.com/prometheus/client_golang/prometheus/promhttp" ) func main() { // 定义指标 cpuUsage := prometheus.NewGauge(prometheus.GaugeOpts{ Name: "cpu_usage", // 指标名称 Help: "this is test metrics cpu usage", // 帮助信息 }) // 给指标设置值 cpuUsage.Set(89.56) // 注册指标 prometheus.MustRegister(cpuUsage) // 暴露指标 http.Handle("/metrics", promhttp.Handler()) http.ListenAndServe(":9900", nil) }3.1.2 带有固定label指标的案例
package main import ( "net/http" "github.com/prometheus/client_golang/prometheus" "github.com/prometheus/client_golang/prometheus/promhttp" ) func main() { // 定义指标 cpuUsage := prometheus.NewGauge(prometheus.GaugeOpts{ Name: "cpu_usage", // 指标名称 Help: "this is test metrics cpu usage", // 帮助信息 ConstLabels: prometheus.Labels{"MachineType": "host"}, // label }) // 给指标设置值 cpuUsage.Set(89.56) // 注册指标 prometheus.MustRegister(cpuUsage) // 暴露指标 http.Handle("/metrics", promhttp.Handler()) http.ListenAndServe(":9900", nil) }3.1.3 带有非固定label指标的案例
package main import ( "net/http" "github.com/prometheus/client_golang/prometheus" "github.com/prometheus/client_golang/prometheus/promhttp" ) func main() { //定义带有不固定label的指标 mtu := prometheus.NewGaugeVec(prometheus.GaugeOpts{ Name: "interface_mtu", Help: "网卡接口MTU", }, []string{"interface", "Machinetype"}) // 给指标设置值 mtu.WithLabelValues("lo", "host").Set(1500) mtu.WithLabelValues("ens32", "host").Set(1500) mtu.WithLabelValues("eth0", "host").Set(1500) // 注册指标 prometheus.MustRegister(mtu) // 暴露指标 http.Handle("/metrics", promhttp.Handler()) http.ListenAndServe(":9900", nil) } 3.2 Counter指标类型
3.2.1 不带label的基本案例
package main import ( "net/http" "github.com/prometheus/client_golang/prometheus" "github.com/prometheus/client_golang/prometheus/promhttp" ) func main() { // 定义指标 reqTotal := prometheus.NewCounter(prometheus.CounterOpts{ Name: "current_request_total", Help: "当前请求总数", }) // 注册指标 prometheus.MustRegister(reqTotal) // 设置值 reqTotal.Add(10) // 暴露指标 http.Handle("/metrics", promhttp.Handler()) http.ListenAndServe(":9900", nil) } 3.2.2 带有固定label指标的案例
package main import ( "net/http" "github.com/prometheus/client_golang/prometheus" "github.com/prometheus/client_golang/prometheus/promhttp" ) func main() { // 定义指标 suceReqTotal := prometheus.NewCounter(prometheus.CounterOpts{ Name: "sucess_request_total", Help: "请求成功的总数", ConstLabels: prometheus.Labels{"StatusCode": "200"}, }) // 注册指标 prometheus.MustRegister(suceReqTotal) // 设置值 suceReqTotal.Add(5675) // 暴露指标 http.Handle("/metrics", promhttp.Handler()) http.ListenAndServe(":9900", nil) }3.2.3 带有非固定label指标的案例
package main import ( "net/http" "github.com/prometheus/client_golang/prometheus" "github.com/prometheus/client_golang/prometheus/promhttp" ) func main() { // 定义指标 pathReqTotal := prometheus.NewCounterVec(prometheus.CounterOpts{ Name: "path_request_total", Help: "path请求总数", }, []string{"path"}) // 注册指标 prometheus.MustRegister(pathReqTotal) // 设置值 pathReqTotal.WithLabelValues("/token").Add(37) pathReqTotal.WithLabelValues("/auth").Add(23) pathReqTotal.WithLabelValues("/user").Add(90) pathReqTotal.WithLabelValues("/api").Add(67) // 暴露指标 http.Handle("/metrics", promhttp.Handler()) http.ListenAndServe(":9900", nil) }3.3 Counter指标类型
3.3.1 不带label的案例
package main import ( "net/http" "github.com/prometheus/client_golang/prometheus" "github.com/prometheus/client_golang/prometheus/promhttp" ) func main() { // 定义指标 reqDelay := prometheus.NewHistogram(prometheus.HistogramOpts{ Name: "request_delay", Help: "请求延迟,单位秒", Buckets: prometheus.LinearBuckets(0, 3, 6), // 调用LinearBuckets生成区间,从0开始,宽度3,共6个Bucket }) // 注册指标 prometheus.MustRegister(reqDelay) // 设置值 reqDelay.Observe(6) // 暴露指标 http.Handle("/metrics", promhttp.Handler()) http.ListenAndServe(":9900", nil) }3.3.2 带固定label的案例
package main import ( "net/http" "github.com/prometheus/client_golang/prometheus" "github.com/prometheus/client_golang/prometheus/promhttp" ) func main() { // 定义指标 reqDelay := prometheus.NewHistogram(prometheus.HistogramOpts{ Name: "request_delay", Help: "请求延迟,单位秒", Buckets: prometheus.LinearBuckets(0, 3, 6), // 调用LinearBuckets生成区间,从0开始,宽度3,共6个Bucket ConstLabels: prometheus.Labels{"path": "/api"}, }) // 注册指标 prometheus.MustRegister(reqDelay) // 设置值 reqDelay.Observe(6) // 暴露指标 http.Handle("/metrics", promhttp.Handler()) http.ListenAndServe(":9900", nil) }3.3.3 带有非固定label的案例
package main import ( "net/http" "github.com/prometheus/client_golang/prometheus" "github.com/prometheus/client_golang/prometheus/promhttp" ) func main() { // 定义指标 reqDelay := prometheus.NewHistogramVec(prometheus.HistogramOpts{ Name: "request_delay", Help: "请求延迟,单位秒", Buckets: prometheus.LinearBuckets(0, 3, 6), // 调用LinearBuckets生成区间,从0开始,宽度3,共6个Bucket }, []string{"path"}) // 注册指标 prometheus.MustRegister(reqDelay) // 设置值 reqDelay.WithLabelValues("/api").Observe(6) reqDelay.WithLabelValues("/user").Observe(3) reqDelay.WithLabelValues("/delete").Observe(2) reqDelay.WithLabelValues("/get_token").Observe(13) // 暴露指标 http.Handle("/metrics", promhttp.Handler()) http.ListenAndServe(":9900", nil) }3.4 Summary指标类型
3.4.1 不带label的案例
package main import ( "net/http" "github.com/prometheus/client_golang/prometheus" "github.com/prometheus/client_golang/prometheus/promhttp" ) func main() { // 定义指标 reqDelay := prometheus.NewSummary(prometheus.SummaryOpts{ Name: "request_delay", Help: "请求延迟", Objectives: map[float64]float64{0.5: 0.05, 0.90: 0.01, 0.99: 0.001}, // 百分比:精度 }) // 注册指标 prometheus.MustRegister(reqDelay) // 设置值 reqDelay.Observe(4) // 暴露指标 http.Handle("/metrics", promhttp.Handler()) http.ListenAndServe(":9900", nil) }3.4.2 带有固定label的案例
package main import ( "net/http" "github.com/prometheus/client_golang/prometheus" "github.com/prometheus/client_golang/prometheus/promhttp" ) func main() { // 定义指标 reqDelay := prometheus.NewSummary(prometheus.SummaryOpts{ Name: "request_delay", Help: "请求延迟", Objectives: map[float64]float64{0.5: 0.05, 0.90: 0.01, 0.99: 0.001}, // 百分比:精度 ConstLabels: prometheus.Labels{"path": "/api"}, }) // 注册指标 prometheus.MustRegister(reqDelay) // 设置值 reqDelay.Observe(4) // 暴露指标 http.Handle("/metrics", promhttp.Handler()) http.ListenAndServe(":9900", nil) }3.4.3 带有非固定label的案例
package main import ( "net/http" "github.com/prometheus/client_golang/prometheus" "github.com/prometheus/client_golang/prometheus/promhttp" ) func main() { // 定义指标 reqDelay := prometheus.NewSummaryVec(prometheus.SummaryOpts{ Name: "request_delay", Help: "请求延迟", Objectives: map[float64]float64{0.5: 0.05, 0.90: 0.01, 0.99: 0.001}, // 百分比:精度 }, []string{"path"}) // 注册指标 prometheus.MustRegister(reqDelay) // 设置值 reqDelay.WithLabelValues("/api").Observe(4) reqDelay.WithLabelValues("/token").Observe(2) reqDelay.WithLabelValues("/user").Observe(3) // 暴露指标 http.Handle("/metrics", promhttp.Handler()) http.ListenAndServe(":9900", nil) }3.5 值的修改
3.5.1 基于事件的触发来修改值,比如每访问1次/api就增1
基于事件的触发对指标的值进行修改,通常大多数是来自业务方面的指标需求,如自研的应用需要暴露相关指标给promethus进行监控、展示,那么指标采集的代码(指标定义、设置值)就要嵌入到自研应用代码里了。
package main import ( "fmt" "net/http" "github.com/prometheus/client_golang/prometheus" "github.com/prometheus/client_golang/prometheus/promhttp" ) func main() { urlRequestTotal := prometheus.NewCounterVec(prometheus.CounterOpts{ Name: "urlRequestTotal", Help: "PATH请求累计 单位 次", }, []string{"path"}) http.HandleFunc("/api", func(w http.ResponseWriter, r *http.Request) { urlRequestTotal.WithLabelValues(r.URL.Path).Inc() // 使用Inc函数进行增1 fmt.Fprintf(w, "Welcome to the api") }) prometheus.MustRegister(urlRequestTotal) http.Handle("/metrics", promhttp.Handler()) http.ListenAndServe(":9900", nil) }3.5.2 基于时间周期的触发来修改值,比如下面的示例中,是每间隔1秒获取cpu负载指标
基于时间周期的触发,可以是多少秒、分、时、日、月、周。
package main import ( "net/http" "time" "github.com/prometheus/client_golang/prometheus" "github.com/prometheus/client_golang/prometheus/promhttp" "github.com/shirou/gopsutil/load" ) func main() { cpuUsage := prometheus.NewGaugeVec(prometheus.GaugeOpts{ Name: "CpuLoad", Help: "CPU负载", }, []string{"time"}) // 开启一个子协程执行该匿名函数内的逻辑来给指标设置值,且每秒获取一次 go func() { for range time.Tick(time.Second) { info, _ := load.Avg() cpuUsage.WithLabelValues("Load1").Set(float64(info.Load1)) cpuUsage.WithLabelValues("Load5").Set(float64(info.Load5)) cpuUsage.WithLabelValues("Load15").Set(float64(info.Load15)) } }() prometheus.MustRegister(cpuUsage) http.Handle("/metrics", promhttp.Handler()) http.ListenAndServe(":9900", nil) }3.5.3 基于每访问一次获取指标的URI才修改值,比如每次访问/metrics才去修改某些指标的值
案例是每访问一次/metrics就获取一次内存总容量
package main import ( "fmt" "net/http" "github.com/prometheus/client_golang/prometheus" "github.com/prometheus/client_golang/prometheus/promhttp" "github.com/shirou/gopsutil/mem" ) func main() { MemTotal := prometheus.NewGaugeFunc(prometheus.GaugeOpts{ Name: "MemTotal", Help: "内存总容量 单位 GB", }, func() float64 { fmt.Println("call MemTotal ...") info, _ := mem.VirtualMemory() return float64(info.Total / 1024 / 1024 / 1024) }) prometheus.MustRegister(MemTotal) http.Handle("/metrics", promhttp.Handler()) http.ListenAndServe(":9900", nil) }目前只有Gauge和Counter的指标类型有对应的函数,分别是NewGaugeFunc和NewCounterFunc,而且是固定的label。
4 prometheus获取被监控对象的监控指标数据方式
- HTTP/HTTPs,例如Rabbitmq Exporter通过HTTPs接口获取监控数据。
- TCP,例如Redis Exporter通过Redis提供的系统监控相关命令获取监控指标,MySQL Server Exporter通过MySQL开放的监控相关的表获取监控指标
- 本地文件,例如Node Exporter通过读取整个proc文件系统下的文件,得到整个系统的当前状态。
- 标准协议,例如IPMI Exporter通过IPMI协议获取硬件相关信息,并将这些信息的格式进行转化,输出为Prometheus能够识别的监控数据格式,从而扩大Prometheus的数据采集能力。
5 Exporter规范
所有的Exporter程序都需要按照Prometheus的规范,返回监控的样本数据。以Node Exporter为例,当访问/metrics地址时会返回以下内容:
# HELP node_cpu Seconds the cpus spent in each mode. # TYPE node_cpu counter node_cpu{cpu="cpu0",mode="idle"} . # HELP node_load1 1m load average. # TYPE node_load1 gauge node_load1 3.0这是一种基于文本的格式规范,在Prometheus 2.0之前的版本还支持Protocol buffer规范。相比于Protocol buffer文本具有更好的可读性,以及跨平台性。Prometheus 2.0的版本也已经不再支持Protocol buffer,这里就不对Protocol buffer规范做详细的阐述。
Exporter返回的样本数据,主要由三个部分组成:样本的一般注释信息(HELP),样本的类型注释信息(TYPE)和样本。Prometheus会对Exporter响应的内容逐行解析:
- 如果当前行以# HELP开始,Prometheus将会按照以下规则对内容进行解析,得到当前的指标名称以及相应的说明信息:
# HELP <metrics_name> <doc_string>- 如果当前行以# TYPE开始,Prometheus会按照以下规则对内容进行解析,得到当前的指标名称以及指标类型:
# TYPE <metrics_name> <metrics_type>TYPE注释行必须出现在指标的第一个样本之前。如果没有明确的指标类型需要返回为untyped。 除了# 开头的所有行都会被视为是监控样本数据。 每一行样本需要满足以下格式规范:
metric_name [ "{" label_name "=" `"` label_value `"` { "," label_name "=" `"` label_value `"` } [ "," ] "}" ] value [ timestamp ]其中metric_name和label_name必须遵循PromQL的格式规范要求。value是一个float格式的数据,timestamp的类型为int64(从1970-01-01 00:00:00以来的毫秒数),timestamp为可选默认为当前时间。具有相同metric_name的样本必须按照一个组的形式排列,并且每一行必须是唯一的指标名称和标签键值对组合。
需要特别注意的是对于histogram和summary类型的样本。需要按照以下约定返回样本数据:
- 类型为summary或者histogram的指标x,该指标所有样本的值的总和需要使用一个单独的x_sum指标表示。
- 类型为summary或者histogram的指标x,该指标所有样本的总数需要使用一个单独的x_count指标表示。
- 对于类型为summary的指标x,其不同分位数quantile所代表的样本,需要使用单独的x{quantile=“y”}表示。
- 对于类型histogram的指标x为了表示其样本的分布情况,每一个分布需要使用x_bucket{le=“y”}表示,其中y为当前分布的上位数。同时必须包含一个样本x_bucket{le="+Inf"},并且其样本值必须和x_count相同。
- 对于histogram和summary的样本,必须按照分位数quantile和分布le的值的递增顺序排序。
以下是类型为histogram和summary的样本输出示例:
# A histogram, which has a pretty complex representation in the text format: # HELP http_request_duration_seconds A histogram of the request duration. # TYPE http_request_duration_seconds histogram http_request_duration_seconds_bucket{le="0.05"} 24054 http_request_duration_seconds_bucket{le="0.1"} 33444 http_request_duration_seconds_bucket{le="0.2"} http_request_duration_seconds_bucket{le="+Inf"} http_request_duration_seconds_sum 53423 http_request_duration_seconds_count # Finally a summary, which has a complex representation, too: # HELP rpc_duration_seconds A summary of the RPC duration in seconds. # TYPE rpc_duration_seconds summary rpc_duration_seconds{quantile="0.01"} 3102 rpc_duration_seconds{quantile="0.05"} 3272 rpc_duration_seconds{quantile="0.5"} 4773 rpc_duration_seconds_sum 1.e+07 rpc_duration_seconds_count 2693对于某些Prometheus还没有提供支持的编程语言,用户只需要按照以上规范返回响应的文本数据即可。
5.1 指定样本格式的版本
在Exporter响应的HTTP头信息中,可以通过Content-Type指定特定的规范版本,例如:
HTTP/1.1 200 OK
Content-Encoding: gzip
Content-Length: 2906
Content-Type: text/plain; version=0.0.4
Date: Sat, 17 Mar 2018 08:47:06 GMT
其中version用于指定Text-based的格式版本,当没有指定版本的时候,默认使用最新格式规范的版本。同时HTTP响应头还需要指定压缩格式为gzip。
今天的文章 Prometheus监控实战之exporter详解分享到此就结束了,感谢您的阅读。
版权声明:本文内容由互联网用户自发贡献,该文观点仅代表作者本人。本站仅提供信息存储空间服务,不拥有所有权,不承担相关法律责任。如发现本站有涉嫌侵权/违法违规的内容, 请发送邮件至 举报,一经查实,本站将立刻删除。
如需转载请保留出处:https://bianchenghao.cn/bian-cheng-ji-chu/90866.html