|
1
2
3
4
5
6
7
8
9
10
11
12
13
14
15
16
17
18
19
20
21
22
23
24
25
26
27
28
29
30
31
|
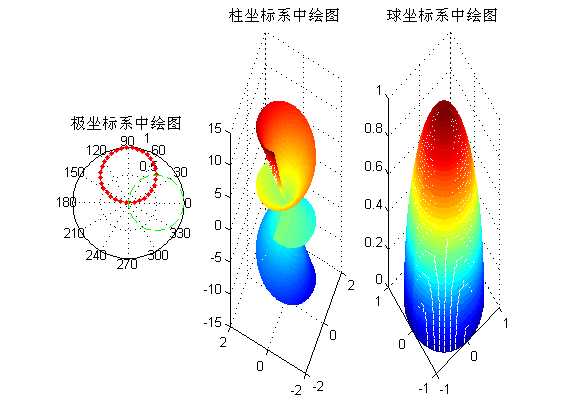
%% ==========在特殊坐标系中绘制特殊图形。=======
%利用polar函数在极坐标系中绘制图形
figure;
theta=0:.1:pi;
rho1=sin(theta);
rho2=cos(theta);
subplot(1,3,1);
polar(theta,rho1,'.-r');
hold on;
polar(theta,rho2,'--g');
title('极坐标系中绘图');
%另外一种和极坐标有关系的坐标系就是柱坐标系了
theta=0:pi/100:3*pi;
rho=sin(theta)+cos(theta);
[t,r]=meshgrid(theta,rho);
z=r.*t;
subplot(1,3,2);
[x,y,z]=pol2cart(t,r,z);%极坐标系向柱坐标系转化
mesh(x,y,z);%柱坐标系中进行绘图
title('柱坐标系中绘图');
view([-65 30]);
%将球坐标系转换为柱面坐标系
subplot(1,3,3);
delta=pi/100;
theta=0:delta:pi; % theta is zenith angle
phi=0:delta:pi; % phi is azimuth angle
[t p]=meshgrid(theta,phi);
r=ones(size(t));
[x,y,z]=sph2cart(t,p,r);%球坐标向柱坐标转化
mesh(x,y,z);%球坐标系中进行绘图
title('球坐标系中绘图');
|

