图例位置设置
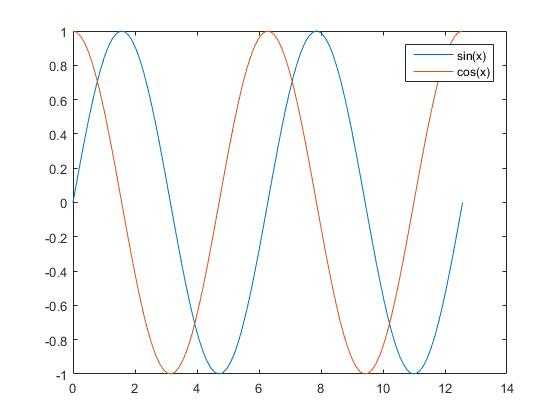
Matlab中legend默认的位置在NorthEast,如图所示:
%Matlab中legend的位置设置 默认在右上方

clc
clear
close all
Npoint = 100;
x = linspace(0,4*pi,Npoint);
y1 = sin(x);
y2 = cos(x);
H = plot(x,y1,x,y2);
legend('sin(x)','cos(x)');
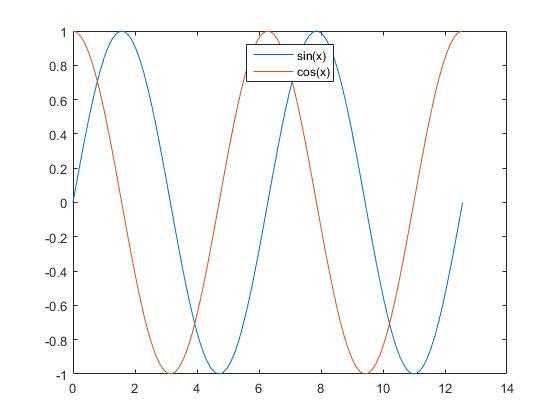
可以通过Location对legend的位置进行改变,变为North,如图所示:
%Matlab中legend的位置设置

clc
clear
close all
Npoint = 100;
x = linspace(0,4*pi,Npoint);
y1 = sin(x);
y2 = cos(x);
H = plot(x,y1,x,y2);
legend('sin(x)','cos(x)','Location','North');
Matlab中有许多位置可以选择:
‘North’ inside plot box near top
‘South’ inside bottom
‘East’ inside right
‘West’ inside left
‘NorthEast’ inside top right (default for 2-D plots)
‘NorthWest’ inside top left
‘SouthEast’ inside bottom right
‘SouthWest’ inside bottom left
‘NorthOutside’ outside plot box near top
‘SouthOutside’ outside bottom
‘EastOutside’ outside right
‘WestOutside’ outside left
‘NorthEastOutside’ outside top right (default for 3-D plots)
‘NorthWestOutside’ outside top left
‘SouthEastOutside’ outside bottom right
‘SouthWestOutside’ outside bottom left
‘Best’ least conflict with data in plot
‘BestOutside’ least unused space outside plot
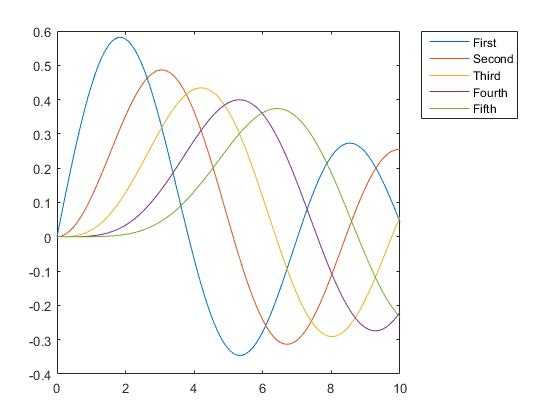
Matlab中还可以选择某条曲线legend的指定显示:
clc
clear
close all
Npoint = 101;
x = linspace(0,10,Npoint);
y1 = besselj(1,x);
y2 = besselj(2,x);
y3 = besselj(3,x);
y4 = besselj(4,x);
y5 = besselj(5,x);
H = plot(x,y1,x,y2,x,y3,x,y4,x,y5);
legend('First','Second','Third','Fourth','Fifth','Location','NorthEastOutside')
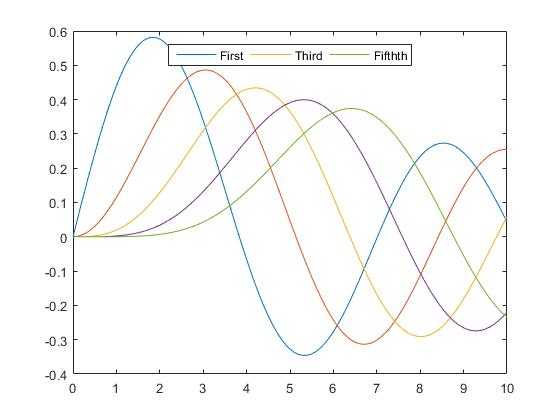
如果只想显示第1、3、5条,也很简单:
%Matlab中legend的选择

clc
clear
close all
Npoint = 101;
x = linspace(0,10,Npoint);
y1 = besselj(1,x);
y2 = besselj(2,x);
y3 = besselj(3,x);
y4 = besselj(4,x);
y5 = besselj(5,x);
H = plot(x,y1,x,y2,x,y3,x,y4,x,y5);
h1 = legend(H([1 3 5]),'First','Third','Fifthth','Location','NorthEastOutside')
%Matlab中legend的横排,注意,Location位置改变为North

clc
clear
close all
Npoint = 101;
x = linspace(0,10,Npoint);
y1 = besselj(1,x);
y2 = besselj(2,x);
y3 = besselj(3,x);
y4 = besselj(4,x);
y5 = besselj(5,x);
H = plot(x,y1,x,y2,x,y3,x,y4,x,y5);
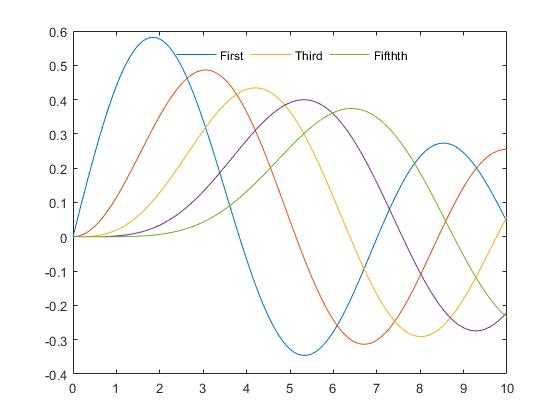
h1 = legend(H([1 3 5]),'First','Third','Fifthth','Location','North');
set(h1,'Orientation','horizon')
不显示方框的图例
clc
clear
close all
Npoint = 101;
x = linspace(0,10,Npoint);
y1 = besselj(1,x);
y2 = besselj(2,x);
y3 = besselj(3,x);
y4 = besselj(4,x);
y5 = besselj(5,x);
H = plot(x,y1,x,y2,x,y3,x,y4,x,y5);
h1 = legend(H([1 3 5]),'First','Third','Fifthth','Location','North');
set(h1,'Orientation','horizon','Box','off')
今天的文章matlab——legend的使用分享到此就结束了,感谢您的阅读。
版权声明:本文内容由互联网用户自发贡献,该文观点仅代表作者本人。本站仅提供信息存储空间服务,不拥有所有权,不承担相关法律责任。如发现本站有涉嫌侵权/违法违规的内容, 请发送邮件至 举报,一经查实,本站将立刻删除。
如需转载请保留出处:https://bianchenghao.cn/23883.html

