参考博客1:
https://blog.csdn.net/sherry_gp/article/details/50560003
感谢博主大大 sherry_gp
参考博客2:
https://blog.csdn.net/stu_lavender/article/details/79615474
感谢博主大大: stu_lavender
参考博客3:
https://www.csdn.net/gather_25/MtzaMg3sNTE0LWJsb2cO0O0O.html
感谢博主大大
0.太长不看版
这是一份demo,直接就可以运行,链接:https://pan.baidu.com/s/1NYMgBkog-dBZ4RGmGHRwbg 提取码:pyit
问一下大家,网盘失效了吗,百度网盘怎么看自己分享的东西失效了没?我这边显示的是永久有效。。。
可供参考,这个是GitHub上的代码,我只是调通了搞懂调用方式而已。
demo里的东西(其实就是网盘里的东西)因为听说网盘失效了。。。然而我不会更新网盘。。。有没有人能在评论区告诉我怎么更新。。。
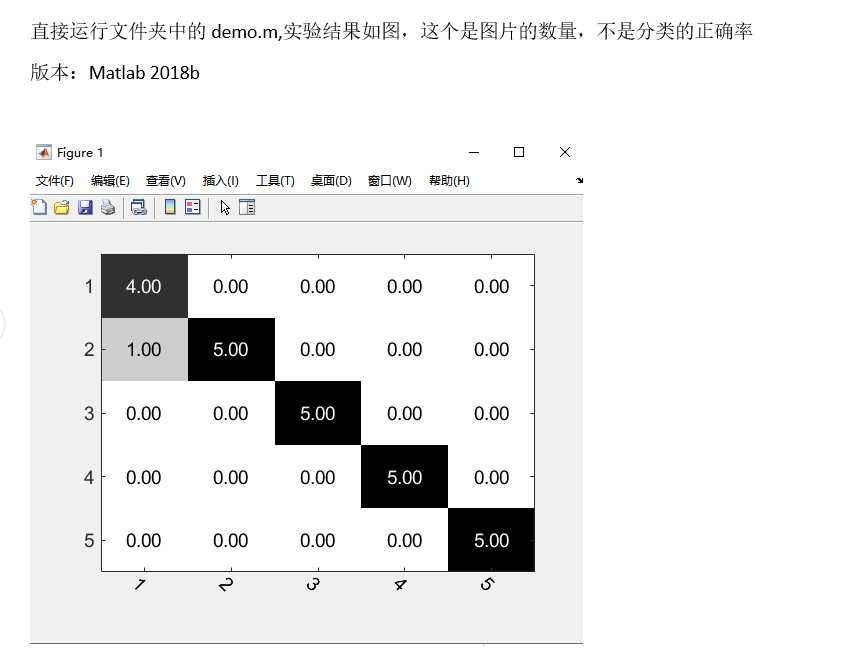
demo.m文件
clc
clear all
% 假设predict_label即预测标签是下面这个1z25的向量说明第1到5张被预测为类1 第6-10张被预测为类2
predict_label=[1 1 1 1 1 2 2 2 2 2 3 3 3 3 3 4 4 4 4 4 5 5 5 5 5];
% predict_label=double(predict_label);%其实这一步比较多余,本来就是double了
name_class={
   '1','2','3','4','5'};


% actual_label=[1 1 1 1 2 2 2 2 2 2 3 3 3 3 3 4 4 4 4 4 5 5 5 5 5 ];
num_in_class=[4 6 5 5 5];%num_in_class就是实际标签每一类的数目
[confusion_matrix]=compute_confusion_matrix(predict_label,num_in_class,name_class);
ps:如果实际中得到的是actual_label,怎么从actual_label得到对应的num_in_class呢?下面是一种方法
actual_label=[1 1 1 1 2 2 2 2 2 2 3 3 3 3 3 4 4 4 4 4 5 5 5 5 5 ];
t=tabulate(actual_label);
num_in_class=t(:,2)';
compute_confusion_matrix.m文件
% 预测标签,每一类的数目,类别数目
function [confusion_matrix]=compute_confusion_matrix(predict_label,num_in_class,name_class)
% predict_label为一维行向量
% num_in_class代表每一类的个数
% name_class代表类名
num_class=length(num_in_class);
num_in_class=[0 num_in_class];

confusion_matrix=size(num_class,num_class);

for ci=1:num_class
    for cj=1:num_class
        summer=0;%统计对应标签个数
        c_start=sum(num_in_class(1:ci))+1;
        c_end=sum(num_in_class(1:ci+1));
        summer=size(find(predict_label(c_start:c_end)==cj),2);  % 统计对应标签个数,注意此处的predict_label可能是数值组成的向量,不是字符串组成的向量
%         confusion_matrix(ci,cj)=summer/num_in_class(ci+1);%这个是显示正确率,
        confusion_matrix(ci,cj)=summer;%这个是显示图片有多少张,
    end
end

draw_cm(confusion_matrix,name_class,num_class);

end
draw_cm.m文件
function draw_cm(mat,tick,num_class)
%%
%  Matlab code for visualization of confusion matrix;
%  Parameters:mat: confusion matrix;
%              tick: name of each class, e.g. 'class_1' 'class_2'...
%              num_class: number of class
%
%  Author: Page( 丕子)
%           Blog: www.shamoxia.com;
%           QQ:379115886;
%           Email: peegeelee@gmail.com
%%
imagesc(1:num_class,1:num_class,mat);            %# in color
colormap(flipud(gray));  %# for gray; black for large value.

textStrings = num2str(mat(:),'%0.2f');
textStrings = strtrim(cellstr(textStrings));
[x,y] = meshgrid(1:num_class);
hStrings = text(x(:),y(:),textStrings(:), 'HorizontalAlignment','center','FontSize',14);
midValue = mean(get(gca,'CLim'));
textColors = repmat(mat(:) > midValue,1,3);
set(hStrings,{
   'Color'},num2cell(textColors,2));  %# Change the text colors

set(gca,'xticklabel',tick,'XAxisLocation','top');
set(gca, 'XTick', 1:num_class, 'YTick', 1:num_class);
set(gca,'yticklabel',tick);
set(gca,'FontSize',14,'Fontname', 'Helvetica');
rotateXLabels(gca, 315 );% rotate the x tick
rotateXLabels.m文件
function hh = rotateXLabels( ax, angle, varargin )
%rotateXLabels: rotate any xticklabels
%
%   hh = rotateXLabels(ax,angle) rotates all XLabels on axes AX by an angle
%   ANGLE (in degrees). Handles to the resulting text objects are returned
%   in HH.
%
%   hh = rotateXLabels(ax,angle,param,value,...) also allows one or more
%   optional parameters to be specified. Possible parameters are:
%     'MaxStringLength'   The maximum length of label to show (default inf)
%
%   Examples:
%   >> bar( hsv(5)+0.05 )
%   >> days = {
   'Monday','Tuesday','Wednesday','Thursday','Friday'};
%   >> set( gca(), 'XTickLabel', days )
%   >> rotateXLabels( gca(), 45 )
%
%   See also: GCA
%             BAR

%   Copyright 2006-2010 The MathWorks Ltd.
%   $Revision: 52 $
%   $Date: 2010-09-30 11:19:49 +0100 (Thu, 30 Sep 2010) $

error( nargchk( 2, inf, nargin ) );
if ~isnumeric( angle ) || ~isscalar( angle )
    error( 'RotateXLabels:BadAngle', 'Parameter ANGLE must be a scalar angle in degrees' )
end
angle = mod( angle, 360 );

[maxStringLength] = parseInputs( varargin{
   :} );

% Get the existing label texts and clear them
[vals, labels] = findAndClearExistingLabels( ax, maxStringLength );

% Create the new label texts
h = createNewLabels( ax, vals, labels, angle );

% Reposition the axes itself to leave space for the new labels

repositionAxes( ax );

% If an X-label is present, move it too
repositionXLabel( ax );

% Store angle
setappdata( ax, 'RotateXLabelsAngle', angle );

% Only send outputs if requested
if nargout
    hh = h;
end

%-------------------------------------------------------------------------%
    function [maxStringLength] = parseInputs( varargin )
        % Parse optional inputs
        maxStringLength = inf;
        if nargin > 0
            params = varargin(1:2:end);
            values = varargin(2:2:end);
            if numel( params ) ~= numel( values )
                error( 'RotateXLabels:BadSyntax', 'Optional arguments must be specified as parameter-value pairs.' );
            end
            if any( ~cellfun( 'isclass', params, 'char' ) )
                error( 'RotateXLabels:BadSyntax', 'Optional argument names must be specified as strings.' );
            end
            for pp=1:numel( params )
                switch upper( params{
   pp} )
                    case 'MAXSTRINGLENGTH'
                        maxStringLength = values{
   pp};

                    otherwise
                        error( 'RotateXLabels:BadParam', 'Optional parameter ''%s'' not recognised.', params{
   pp} );
                end
            end
        end
    end % parseInputs
%-------------------------------------------------------------------------%
    function [vals,labels] = findAndClearExistingLabels( ax, maxStringLength )
        % Get the current tick positions so that we can place our new labels
        vals = get( ax, 'XTick' );

        % Now determine the labels. We look first at for previously rotated labels
        % since if there are some the actual labels will be empty.
        ex = findall( ax, 'Tag', 'RotatedXTickLabel' );
        if isempty( ex )
            % Store the positions and labels
            labels = get( ax, 'XTickLabel' );
            if isempty( labels )
                % No labels!
                return
            else
                if ~iscell(labels)
                    labels = cellstr(labels);
                end
            end
            % Clear existing labels so that xlabel is in the right position
            set( ax, 'XTickLabel', {
   }, 'XTickMode', 'Manual' );
            setappdata( ax, 'OriginalXTickLabels', labels );
        else
            % Labels have already been rotated, so capture them
            labels = getappdata( ax, 'OriginalXTickLabels' );
            delete(ex);
        end
        % Limit the length, if requested
        if isfinite( maxStringLength )
            for ll=1:numel( labels )
                if length( labels{
   ll} ) > maxStringLength
                    labels{
   ll} = labels{
   ll}(1:maxStringLength);
                end
            end
        end

    end % findAndClearExistingLabels

%-------------------------------------------------------------------------%
    function textLabels = createNewLabels( ax, vals, labels, angle )
        % Work out the ticklabel positions
%         ylim = get(ax,'YLim');
%         y = ylim(1);
        zlim = get(ax,'ZLim');
        z = zlim(1);

        % We want to work
        % in normalised coords, but switch to normalised after setting
        % position causes positions to be rounded to the nearest pixel.
        % Instead we can do the calculation by hand.
        xlim = get( ax, 'XLim' );
        normVals = (vals-xlim(1))/(xlim(2)-xlim(1));
        y = 0;

        % Now create new text objects in similar positions.
        textLabels = -1*ones( numel( vals ), 1 );
        for ll=1:numel(vals)
            textLabels(ll) = text( ...
                'Units', 'Normalized', ...
                'Position', [normVals(ll), y, z], ...
                'String', labels{
   ll}, ...
                'Parent', ax, ...
                'Clipping', 'off', ...
                'Rotation', angle, ...
                'Tag', 'RotatedXTickLabel', ...
                'UserData', vals(ll) );
        end

        % Now copy font properties into the texts
        updateFont();

        % Depending on the angle, we may need to change the alignment. We change
        % alignments within 5 degrees of each 90 degree orientation.
        if 0 <= angle && angle < 5
            set( textLabels, 'HorizontalAlignment', 'Center', 'VerticalAlignment', 'Top' );
        elseif 5 <= angle && angle < 85
            set( textLabels, 'HorizontalAlignment', 'Right', 'VerticalAlignment', 'Top' );
        elseif 85 <= angle && angle < 95
            set( textLabels, 'HorizontalAlignment', 'Right', 'VerticalAlignment', 'Middle' );
        elseif 95 <= angle && angle < 175
            set( textLabels, 'HorizontalAlignment', 'Right', 'VerticalAlignment', 'Bottom' );
        elseif 175 <= angle && angle < 185
            set( textLabels, 'HorizontalAlignment', 'Center', 'VerticalAlignment', 'Bottom' );
        elseif 185 <= angle && angle < 265
            set( textLabels, 'HorizontalAlignment', 'Left', 'VerticalAlignment', 'Bottom' );
        elseif 265 <= angle && angle < 275
            set( textLabels, 'HorizontalAlignment', 'Left', 'VerticalAlignment', 'Middle' );
        elseif 275 <= angle && angle < 355
            set( textLabels, 'HorizontalAlignment', 'Left', 'VerticalAlignment', 'Top' );
        else % 355-360
            set( textLabels, 'HorizontalAlignment', 'Center', 'VerticalAlignment', 'Top' );
        end
    end % createNewLabels

%-------------------------------------------------------------------------%
    function repositionAxes( ax )
        % Reposition the axes so that there's room for the labels
        % Note that we only do this if the OuterPosition is the thing being
        % controlled
        if ~strcmpi( get( ax, 'ActivePositionProperty' ), 'OuterPosition' )
            return;
        end

        % Work out the maximum height required for the labels
        textLabels = findall( ax, 'Tag', 'RotatedXTickLabel' );
        maxHeight = 0;
        for ii=1:numel(vals)
            ext = get( textLabels(ii), 'Extent' );
            if ext(4) > maxHeight
                maxHeight = ext(4);
            end
        end

        % Remove listeners while we mess around with things, otherwise we'll
        % trigger redraws recursively
        removeListeners( ax );

        % Change to normalized units for the position calculation
        oldUnits = get( ax, 'Units' );
        set( ax, 'Units', 'Normalized' );

        % Not sure why, but the extent seems to be proportional to the height of the axes.
        % Correct that now.
        set( ax, 'ActivePositionProperty', 'Position' );
        pos = get( ax, 'Position' );
        axesHeight = pos(4);
        % Make sure we don't adjust away the axes entirely!
        heightAdjust = min( (axesHeight*0.9), maxHeight*axesHeight );

        % Move the axes
        if isappdata( ax, 'OriginalAxesPosition' )
            pos = getappdata( ax, 'OriginalAxesPosition' );
        else
            pos = get(ax,'Position');
            setappdata( ax, 'OriginalAxesPosition', pos );
        end
        setappdata( ax, 'PreviousYLim', get( ax, 'YLim' ) );
        set( ax, 'Position', pos+[0 heightAdjust 0 -heightAdjust] )
        set( ax, 'Units', oldUnits );
        set( ax, 'ActivePositionProperty', 'OuterPosition' );

        % Make sure we find out if axes properties are changed
        addListeners( ax );

    end % repositionAxes

%-------------------------------------------------------------------------%
    function repositionXLabel( ax )
        % Try to work out where to put the xlabel

        removeListeners( ax );
        textLabels = findall( ax, 'Tag', 'RotatedXTickLabel' );
        maxHeight = 0;
        for ll=1:numel(vals)
            ext = get( textLabels(ll), 'Extent' );
            if ext(4) > maxHeight
                maxHeight = ext(4);
            end
        end

        % Use the new max extent to move the xlabel
        xlab = get(ax,'XLabel');
        set( xlab, 'Units', 'Normalized', 'Position', [0.5 -maxHeight 0] );
        addListeners( ax );
    end % repositionXLabel

%-------------------------------------------------------------------------%
    function updateFont()
        % Update the rotated text fonts when the axes font changes
        properties = {

            'FontName'
            'FontSize'
            'FontAngle'
            'FontWeight'
            'FontUnits'
            };
        propertyValues = get( ax, properties );
        textLabels = findall( ax, 'Tag', 'RotatedXTickLabel' );
        set( textLabels, properties, propertyValues );
    end % updateFont

%-------------------------------------------------------------------------%
    function onAxesFontChanged()
        updateFont();
        repositionAxes( ax );
        repositionXLabel( ax );
    end % onAxesFontChanged

%-------------------------------------------------------------------------%
    function onAxesPositionChanged()
        % We need to accept the new position, so remove the appdata before
        % redrawing
        if isappdata( ax, 'OriginalAxesPosition' )
            rmappdata( ax, 'OriginalAxesPosition' );
        end
        if isappdata( ax, 'OriginalXLabelPosition' )
            rmappdata( ax, 'OriginalXLabelPosition' );
        end
        repositionAxes( ax );
        repositionXLabel( ax );
    end % onAxesPositionChanged

%-------------------------------------------------------------------------%
    function onAxesLimitsChanged()
        % The limits have moved, so make sure the labels are still ok
        textLabels = findall( ax, 'Tag', 'RotatedXTickLabel' );
        xlim = get( ax, 'XLim' );
        for tt=1:numel( textLabels )
            xval = get( textLabels(tt), 'UserData' );
            pos(1) = (xval-xlim(1)) / (xlim(2)-xlim(1));
            pos(2) = 0;
            % If the tick is off the edge, make it invisible
            if xval<xlim(1) || xval>xlim(2)
                set( textLabels(tt), 'Visible', 'off', 'Position', pos )
            elseif ~strcmpi( get( textLabels(tt), 'Visible' ), 'on' )
                set( textLabels(tt), 'Visible', 'on', 'Position', pos )
            else
                % Just set the position
                set( textLabels(tt), 'Position', pos );
            end
        end

        repositionXLabel( ax );

%         xlab = get(ax,'XLabel');
%         if ~strcmpi( get( xlab, 'Units' ), 'Data' )
%             set( xlab, 'Units', 'data' );
%         end
%         pos = get( xlab, 'Position' );
%         orig_yrange = diff( orig_ylim );
%         new_yrange = diff( ylim );
%         offset = (pos(2)-orig_ylim(1)) / orig_yrange;
%         pos(2) = offset * new_yrange + ylim(1);
%         pos(1) = mean( xlim );
%         set( xlab, 'Position', pos );
%         setappdata( ax, 'PreviousYLim', ylim );
    end % onAxesPositionChanged

%-------------------------------------------------------------------------%
    function addListeners( ax )
        % Create listeners. We store the array of listeners in the axes to make
        % sure that they have the same life-span as the axes they are listening to.
        axh = handle( ax );
        listeners = [
%             handle.listener( axh, findprop( axh, 'FontName' ), 'PropertyPostSet', @onAxesFontChanged )
%             handle.listener( axh, findprop( axh, 'FontSize' ), 'PropertyPostSet', @onAxesFontChanged )
%             handle.listener( axh, findprop( axh, 'FontWeight' ), 'PropertyPostSet', @onAxesFontChanged )
%             handle.listener( axh, findprop( axh, 'FontAngle' ), 'PropertyPostSet', @onAxesFontChanged )
%             handle.listener( axh, findprop( axh, 'FontUnits' ), 'PropertyPostSet', @onAxesFontChanged )
%             handle.listener( axh, findprop( axh, 'OuterPosition' ), 'PropertyPostSet', @onAxesPositionChanged )
%             handle.listener( axh, findprop( axh, 'XLim' ), 'PropertyPostSet', @onAxesLimitsChanged )
%             handle.listener( axh, findprop( axh, 'YLim' ), 'PropertyPostSet', @onAxesLimitsChanged )
%之前报错找不到 handle.listener这个函数,所以上网找解决方案,2014以后的都用  addlistener取代上面那个,
%参考博客 https://blog.csdn.net/stu_lavender/article/details/79615474
            addlistener( axh,'FontName', 'PostSet', @onAxesFontChanged )
            addlistener( axh,'FontSize' , 'PostSet', @onAxesFontChanged )
            addlistener( axh, 'FontWeight' , 'PostSet', @onAxesFontChanged )
            addlistener( axh, 'FontAngle' , 'PostSet', @onAxesFontChanged )
            addlistener( axh,  'FontUnits', 'PostSet', @onAxesFontChanged )
            addlistener( axh,  'OuterPosition' , 'PostSet', @onAxesPositionChanged )
            addlistener( axh, 'XLim' , 'PostSet', @onAxesLimitsChanged )
            addlistener( axh,  'YLim' , 'PostSet', @onAxesLimitsChanged )

            ];
        setappdata( ax, 'RotateXLabelsListeners', listeners );
    end % addListeners

%-------------------------------------------------------------------------%
    function removeListeners( ax )
        % Rempove any property listeners whilst we are fiddling with the axes
        if isappdata( ax, 'RotateXLabelsListeners' )
            delete( getappdata( ax, 'RotateXLabelsListeners' ) );
            rmappdata( ax, 'RotateXLabelsListeners' );
        end
    end % removeListeners


end % EOF
readme的内容
1. MATALAB代码
要评估分类的好坏,经常会用到混淆矩阵,因为我的代码是matlab实现的SVM分类,所以我想找一个matlab实现的混淆矩阵,小白一个,多亏了网上有那么多人家写好了分享出来的代码。
主要代码来源于 https://github.com/lipiji/PG_Curve
如果GitHub上不去的话,这里是网盘链接
链接: https://pan.baidu.com/s/15QwQAP7ivNlXER7jKmn6Hw 提取码: z8q7
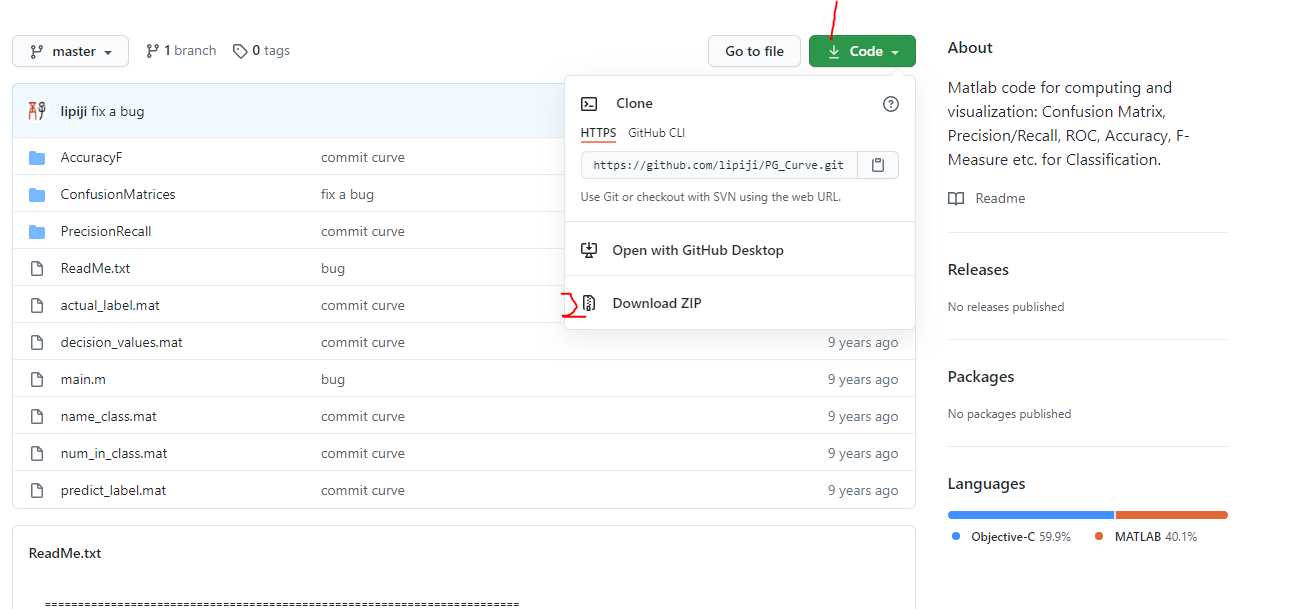
如果能上GitHub但不知道哪里下载的话,就看这张图,先点击右上方绿色的code,再点击download zip就可以下载了,速度有点慢要等一下。
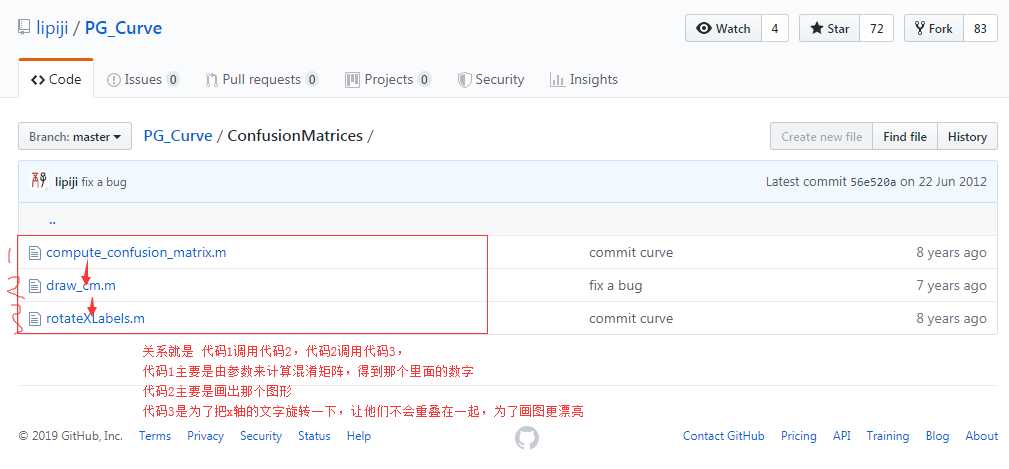
注意这个代码包里面有很多函数,用来实现不同的功能,这里我们用到的只是ConfusionMatrices 文件夹下的三个函数,把它们拷出来和其他代码放在同一个文件夹就可以在其他代码中调用函数,来实现画出混淆的功能了。图1是调用关系,所以实际上我们在其他代码中他、调用的只有代码1,即compute_confusion_matrix.m,但是我这里用的并不是github上的compute_confusion_matrix.m,用的是另外一个版本的,只是我觉得他们好像很像。
下面是我选择的compute_confusion_matrix.m,参考博客 https://blog.csdn.net/hlx371240/article/details/61917472?ops_request_misc=%257B%2522request%255Fid%2522%253A%2522160272512819724836738660%2522%252C%2522scm%2522%253A%252220140713.130102334.pc%255Fall.%2522%257D&request_id=160272512819724836738660&biz_id=0&utm_medium=distribute.pc_search_result.none-task-blog-2allfirst_rank_v2~rank_v28-2-61917472.pc_first_rank_v2_rank_v28&utm_term=+%E4%BD%95%E5%87%8C%E9%9C%84&spm=1018.2118.3001.4187
,感谢作者大大 何凌霄 还有博客作者 小明知道
当时我很疑惑 num_in_class=[0 num_in_class]; 这个和github上的不太一样 这一行是不是错了,结果把它改掉以后,喜闻乐见地发现报错了,所以还是不要改它原来的代码了。
% 预测标签,每一类的数目,类别数目
function [confusion_matrix]=compute_confusion_matrix(predict_label,num_in_class,name_class)
% predict_label为一维行向量
% num_in_class代表每一类的个数
% name_class代表类名
num_class=length(num_in_class);
num_in_class=[0 num_in_class];

confusion_matrix=size(num_class,num_class);

for ci=1:num_class
    for cj=1:num_class
        summer=0;%统计对应标签个数
        c_start=sum(num_in_class(1:ci))+1;
        c_end=sum(num_in_class(1:ci+1));
        summer=size(find(predict_label(c_start:c_end)==cj),2);  % 统计对应标签个数,注意此处的predict_label可能是数值组成的向量,不是字符串组成的向量
        %confusion_matrix(ci,cj)=summer/num_in_class(ci+1);%这个是显示正确率,
        confusion_matrix(ci,cj)=summer;%这个是显示图片有多少张,
    end
end

draw_cm(confusion_matrix,name_class,num_class);

end
需要注意的是,运行时,可能会报错,说代码3即rotateXLabels.m有问题,这是因为原来的代码不适用于我所使用的MATLAB2017,需要稍加修改,然后我百度到了这个
https://blog.csdn.net/stu_lavender/article/details/79615474 ,很好地解决了这个问题
下面的是我的修改,这个是对代码3某个部分的修改,并非是把代码3变成这样子,啊啊啊啊,以前我真的做过这种事。。。保险起见,所以不敢删东西,注释掉即可,MATLAB快捷键为 选中文字,然后ctrl+R可以加注释,Ctrl+T可以去注释。
这个是github上的rotateXLabels.m 改的
 function addListeners( ax )
        % Create listeners. We store the array of listeners in the axes to make
        % sure that they have the same life-span as the axes they are listening to.
        axh = handle( ax );
        listeners = [
%             handle.listener( axh, findprop( axh, 'FontName' ), 'PropertyPostSet', @onAxesFontChanged )
%             handle.listener( axh, findprop( axh, 'FontSize' ), 'PropertyPostSet', @onAxesFontChanged )
%             handle.listener( axh, findprop( axh, 'FontWeight' ), 'PropertyPostSet', @onAxesFontChanged )
%             handle.listener( axh, findprop( axh, 'FontAngle' ), 'PropertyPostSet', @onAxesFontChanged )
%             handle.listener( axh, findprop( axh, 'FontUnits' ), 'PropertyPostSet', @onAxesFontChanged )
%             handle.listener( axh, findprop( axh, 'OuterPosition' ), 'PropertyPostSet', @onAxesPositionChanged )
%             handle.listener( axh, findprop( axh, 'XLim' ), 'PropertyPostSet', @onAxesLimitsChanged )
%             handle.listener( axh, findprop( axh, 'YLim' ), 'PropertyPostSet', @onAxesLimitsChanged )
%之前报错找不到 handle.listener这个函数,所以上网找解决方案,2014以后的都用 addlistener取代上面那个,by wyh
%参考博客 https://blog.csdn.net/stu_lavender/article/details/79615474
            addlistener( axh,'FontName', 'PostSet', @onAxesFontChanged )
            addlistener( axh,'FontSize' , 'PostSet', @onAxesFontChanged )
            addlistener( axh, 'FontWeight' , 'PostSet', @onAxesFontChanged )
            addlistener( axh, 'FontAngle' , 'PostSet', @onAxesFontChanged )
            addlistener( axh,  'FontUnits', 'PostSet', @onAxesFontChanged )
            addlistener( axh,  'OuterPosition' , 'PostSet', @onAxesPositionChanged )
            addlistener( axh, 'XLim' , 'PostSet', @onAxesLimitsChanged )
            addlistener( axh,  'YLim' , 'PostSet', @onAxesLimitsChanged )

            ];
        setappdata( ax, 'RotateXLabelsListeners', listeners );
    end % addListeners
这样以后,就可以了,不会报错了。
2. 如何调用这个函数
(PS:括号内是更新的内容——在另一个博客下老是有人说混淆矩阵报错。。。所以这个是一份demo,直接就可以运行,链接:https://pan.baidu.com/s/1NYMgBkog-dBZ4RGmGHRwbg 提取码:pyit 复制这段内容后打开百度网盘手机App,操作更方便哦)
但是当初对于我来说,最难的并不是这个,而是有了函数不知道怎么往里面传参数。就好像有了很好的工具但是找不到说明书。。。
调用的形式是这样的,
[confusion_matrix]=compute_confusion_matrix(predict_label,num_in_class,name_class);
在我找到的那个源文件中,有对这4个参数的说明,但是对于我这个纯新手来说,这个还是太难了。。。感觉实在好难啊,卡了好久。
现在做个说明,参数1:predict_label,是一个1xN的行向量,N是测试图片的张数,例如我的测试集有919张图片,那么我的predict_label就是1×919的向量。
在MATLAB工作区中的样子
这个意味着第1张图片被预测为第一类,第6张图片被预测为第二类,以此类推。。。
值得注意的是,这个其实就是你的分类结果,一般到了这一步,前面都有这个变量,没有的话就构造出来,反正你最后要有这个东西,然后把你代码中的这个东西的变量名放在参数1的位置上,当然了,最好在save中保存工作区的文件,保存的东西为.mat格式,这样就可以不用再跑代码,直接下次load它。但是说是这么说,我还没用过load,只用过save命令。。。
参数2:num_in_class,这参数代表了每个类的数目
例如我在分类代码中写:num_in_class=[68,136,170,76,178,71,140,80];意味着我的第一类有68张图片,第2类有136张。。。当然该变量也可以不叫num_in_class,你可以自己取名字,只要知道这是同一个东西,把它放在参数2的位置即可。
参数3:name_class,这个参数代表了每个类的名字,
例如我在分类代码中写
name_class={‘1’,‘2’,‘3’,‘4’,‘5’,‘6’,‘7’,‘8’};
意味着我的第一类叫‘ 1,这个参数三和参数二要对应。
其实我代码里还有一个真实标签,是列向量NX1,例如919×1。但是不知道有没有用。
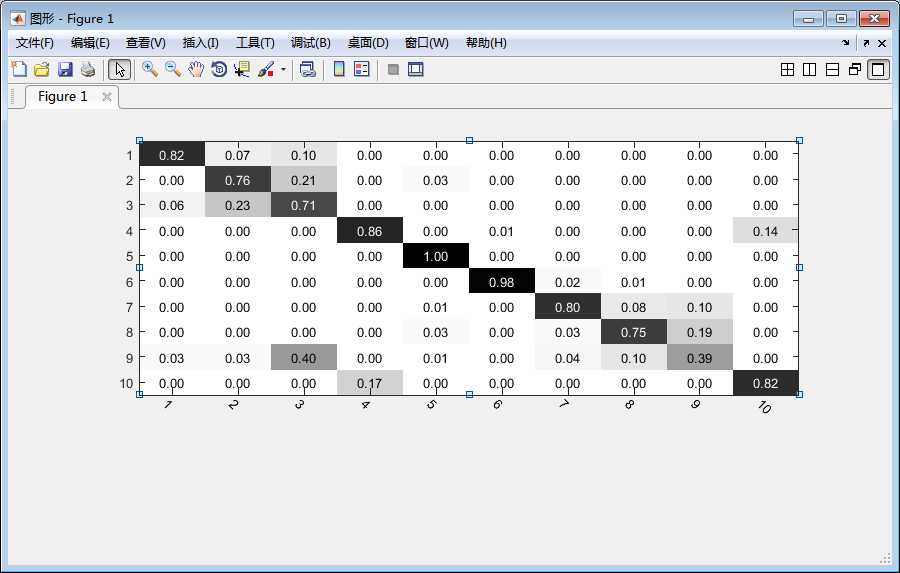
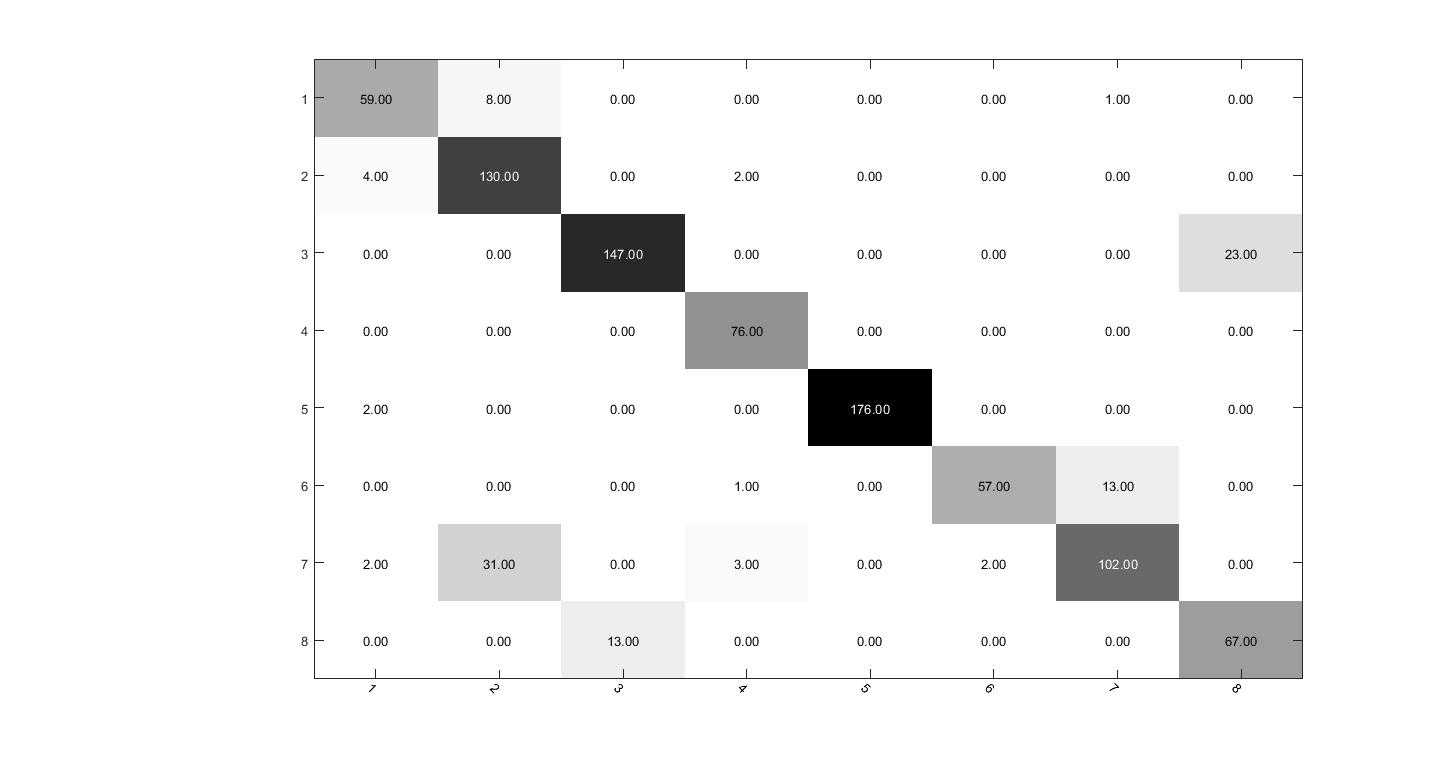
然后就可以调用这个函数了,结果如图。
我们会发现这个说的是小数,不是最原始的图片数目,为了更加原始,我们修改它compute_confusion_matrix函数,其实就是最后一行直接用summer就好了,不要再除了
        %confusion_matrix(ci,cj)=summer/num_in_class(ci+1);%这个是显示正确率,
        confusion_matrix(ci,cj)=summer;%这个是显示图片有多少张,
这样改动以后,就是原始数据了
3. 结果的保存
关于保存结果,建议保存为.fig形式,这个是最原始的图片。有了它就可以把它导出为其他各种图片形式,比如jpg格式。具体操作是 用matlab打开fig文件,点“文件”——“导出设置”——设置好以后点击“导出”即可,分辨率可以设置为300或600,这样比qq截图分辨率高很多,而且.fig是最原始的数据,以后如果要在上面临时改字体大小或者标签也很方便,不用再跑一次实验,节省时间和精力。
版权声明:本文内容由互联网用户自发贡献,该文观点仅代表作者本人。本站仅提供信息存储空间服务,不拥有所有权,不承担相关法律责任。如发现本站有涉嫌侵权/违法违规的内容, 请发送邮件至 举报,一经查实,本站将立刻删除。
如需转载请保留出处:https://bianchenghao.cn/37997.html

