pytorch测试结果转换为numpy格式
代码主要来自该博文 混淆矩阵的绘制(Plot a confusion matrix)
# 分类模型测试阶段代码

# 创建一个空矩阵存储混淆矩阵
conf_matrix = torch.zeros(cfg.NUM_CLASSES, cfg.NUM_CLASSES)
for batch_images, batch_labels in test_dataloader:
   # print(batch_labels)
   with torch.no_grad():
       if torch.cuda.is_available():
           batch_images, batch_labels = batch_images.cuda(),batch_labels.cuda()

   out = model(batch_images)

   prediction = torch.max(out, 1)[1]
   conf_matrix = analytics.confusion_matrix(prediction, labels=batch_labels, conf_matrix=conf_matrix)

# conf_matrix需要是numpy格式
# attack_types是分类实验的类别,eg:attack_types = ['Normal', 'DoS', 'Probe', 'R2L', 'U2R']
analytics.plot_confusion_matrix(conf_matrix.numpy(), classes=attack_types, normalize=False,
                                 title='Normalized confusion matrix')
# 更新混淆矩阵
def confusion_matrix(preds, labels, conf_matrix):
    for p, t in zip(preds, labels):
        conf_matrix[p, t] += 1
    return conf_matrix
# 绘制混淆矩阵
def plot_confusion_matrix(cm, classes, normalize=False, title='Confusion matrix', cmap=plt.cm.Blues):
	''' This function prints and plots the confusion matrix. Normalization can be applied by setting `normalize=True`. Input - cm : 计算出的混淆矩阵的值 - classes : 混淆矩阵中每一行每一列对应的列 - normalize : True:显示百分比, False:显示个数 '''
    if normalize:
        cm = cm.astype('float') / cm.sum(axis=1)[:, np.newaxis]
        print("Normalized confusion matrix")
    else:
        print('Confusion matrix, without normalization')
    print(cm)
    plt.imshow(cm, interpolation='nearest', cmap=cmap)
    plt.title(title)
    plt.colorbar()
    tick_marks = np.arange(len(classes))
    plt.xticks(tick_marks, classes, rotation=90)
    plt.yticks(tick_marks, classes)

	# 。。。。。。。。。。。。新增代码开始处。。。。。。。。。。。。。。。。
	# x,y轴长度一致(问题1解决办法)
    plt.axis("equal")
    # x轴处理一下,如果x轴或者y轴两边有空白的话(问题2解决办法)
    ax = plt.gca()  # 获得当前axis
    left, right = plt.xlim()  # 获得x轴最大最小值
    ax.spines['left'].set_position(('data', left))
    ax.spines['right'].set_position(('data', right))
    for edge_i in ['top', 'bottom', 'right', 'left']:
        ax.spines[edge_i].set_edgecolor("white")
	# 。。。。。。。。。。。。新增代码结束处。。。。。。。。。。。。。。。。

    thresh = cm.max() / 2.
    for i, j in itertools.product(range(cm.shape[0]), range(cm.shape[1])):
        num = '{:.2f}'.format(cm[i, j]) if normalize else int(cm[i, j])
        plt.text(i, j, num,
                 verticalalignment='center',
                 horizontalalignment="center",
                 color="white" if num > thresh else "black")
    plt.tight_layout()
    plt.ylabel('True label')
    plt.xlabel('Predicted label')
    plt.show()
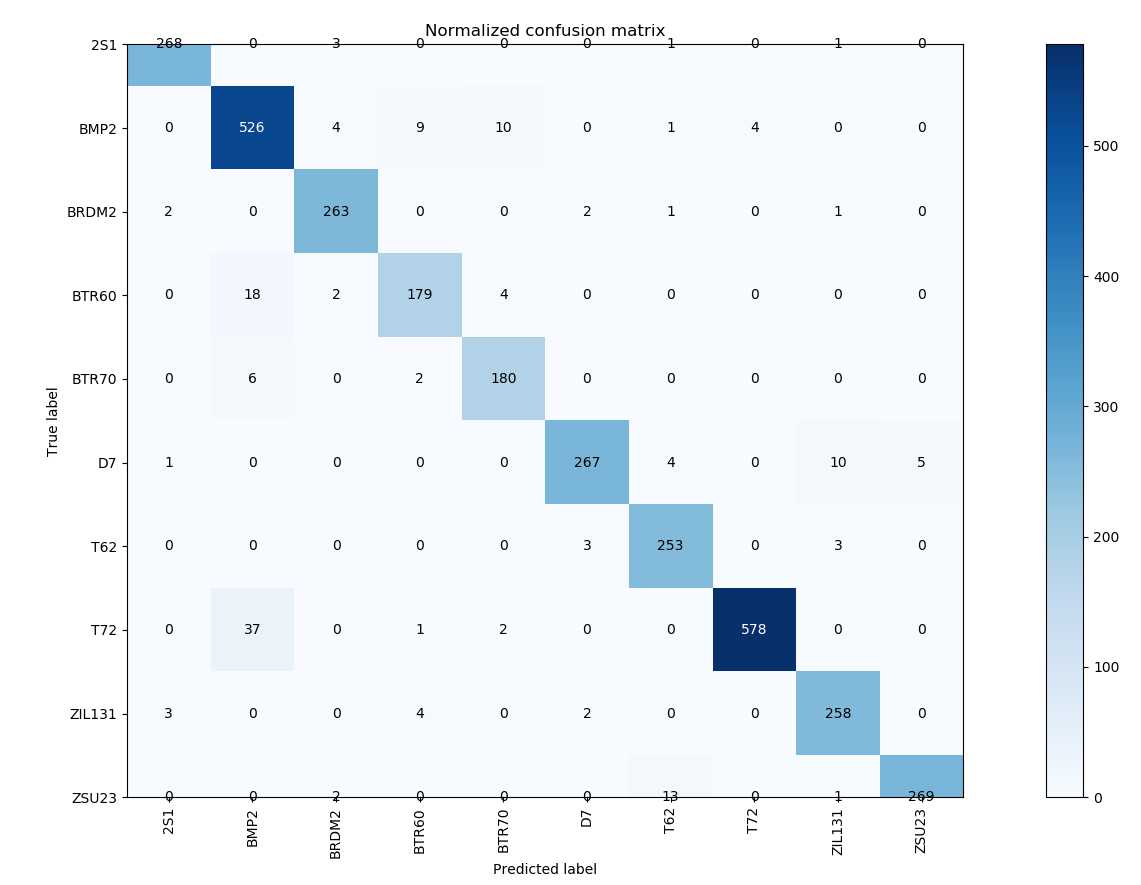
调试期间主要问题截图
问题1,显示不全,类别有10类
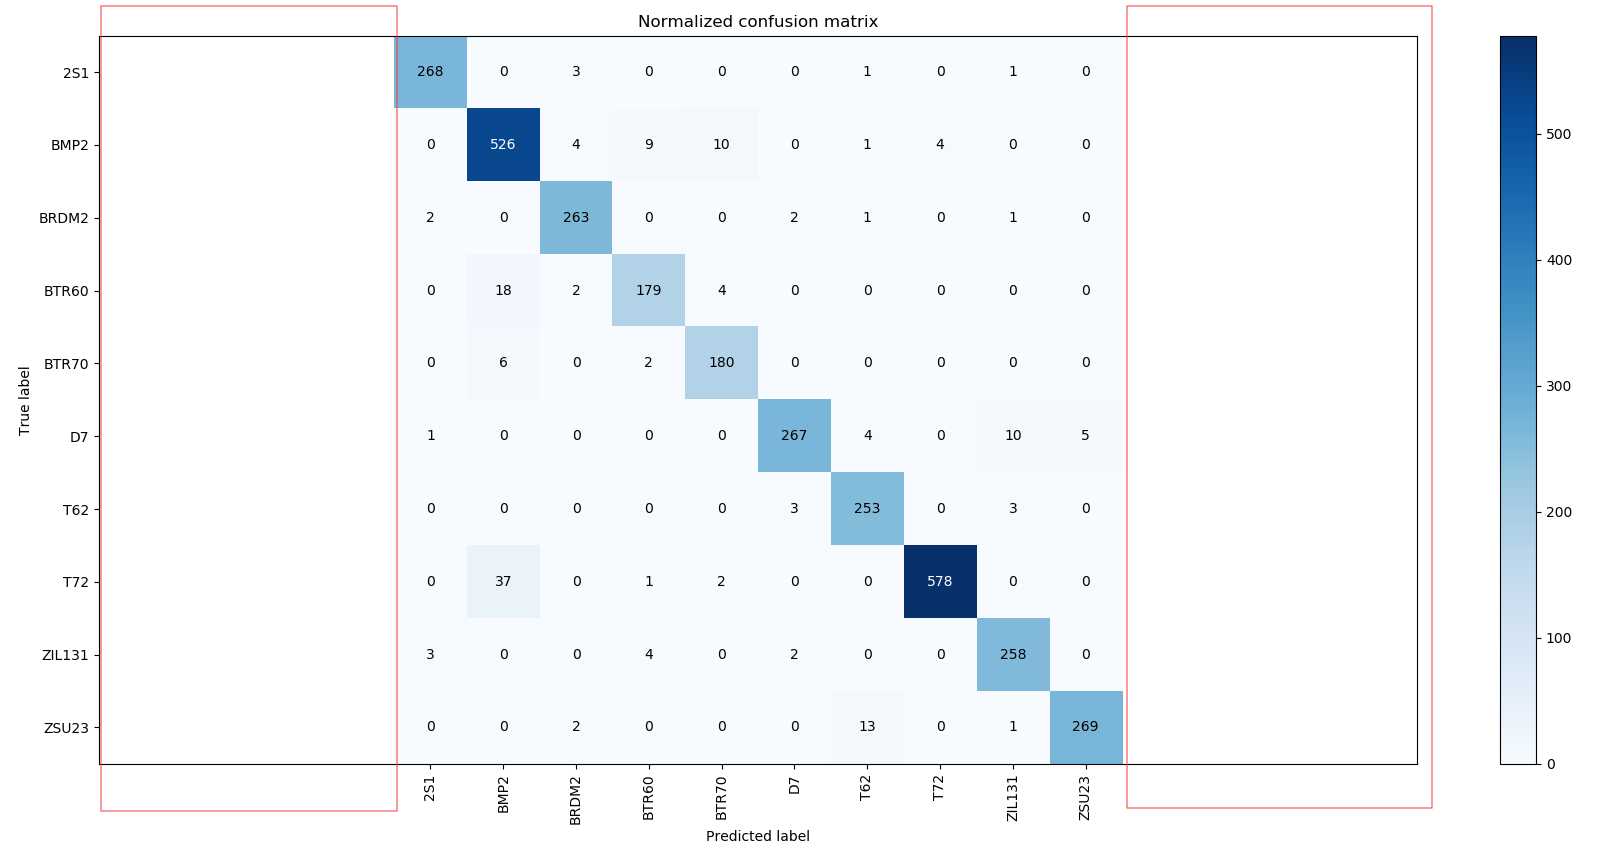
加了以后 plt.axis(“equal”),出现新问题,多了两处空白,红框标注
问题2
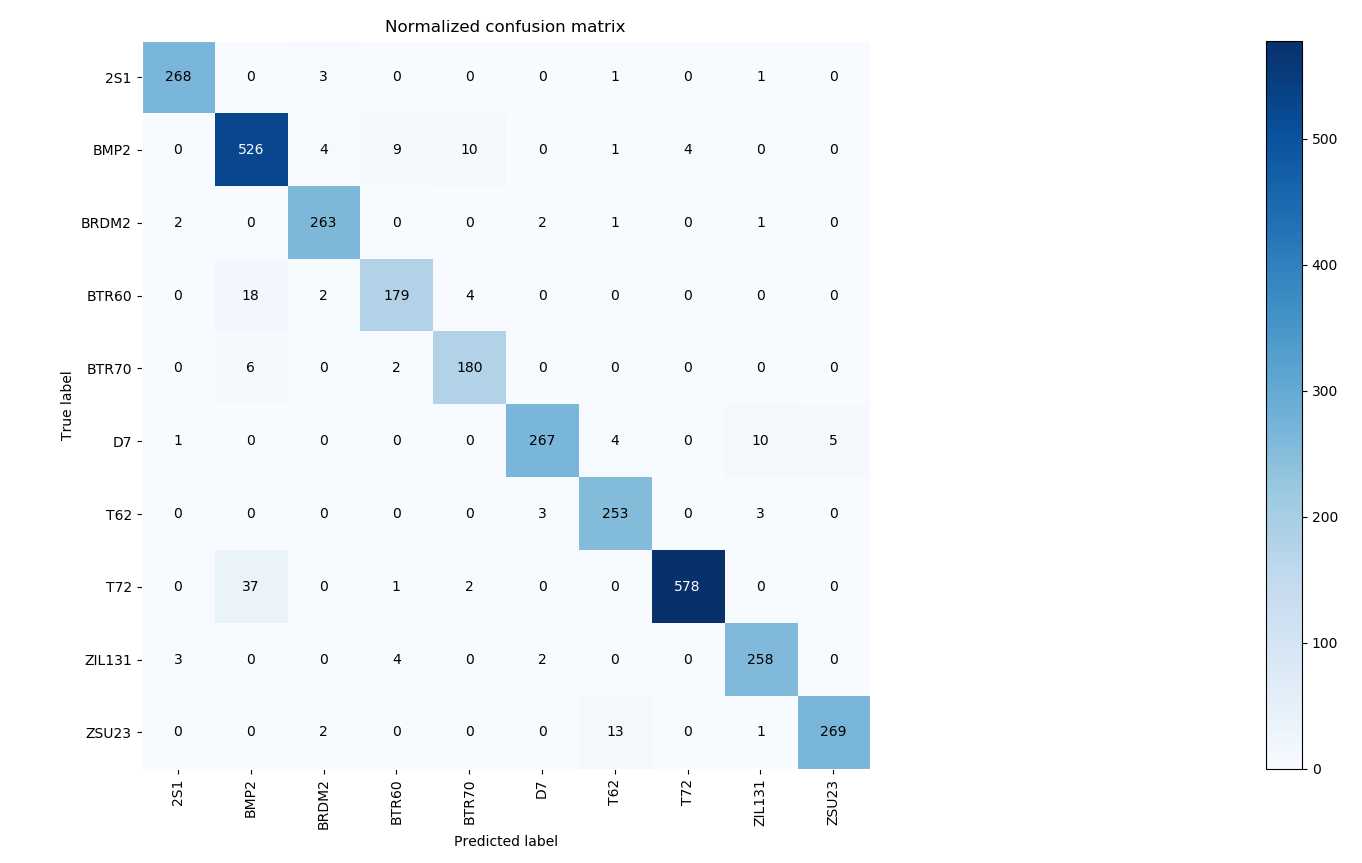
加了下面代码之后,解决问题
用matplotlib去除x軸和y軸的黑線
ax = plt.gca()  # 获得当前axis
left, right = plt.xlim()  # 获得x轴最大最小值
ax.spines['left'].set_position(('data', left))
ax.spines['right'].set_position(('data', right))
for edge_i in ['top', 'bottom', 'right', 'left']:
ax.spines[edge_i].set_edgecolor("white")
版权声明:本文内容由互联网用户自发贡献,该文观点仅代表作者本人。本站仅提供信息存储空间服务,不拥有所有权,不承担相关法律责任。如发现本站有涉嫌侵权/违法违规的内容, 请发送邮件至 举报,一经查实,本站将立刻删除。
如需转载请保留出处:https://bianchenghao.cn/38113.html


