matplotlib
1、plt.plot(x,y)
plt.plot(x,y,format_string,**kwargs)
x轴数据,y轴数据,format_string控制曲线的格式字串
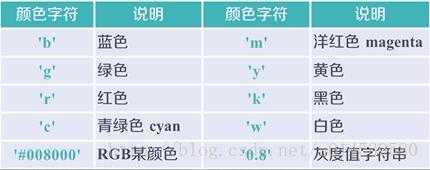
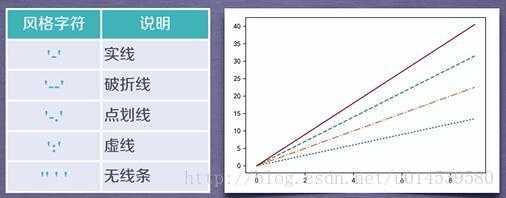
format_string 由颜色字符,风格字符,和标记字符
import matplotlib.pyplot as plt
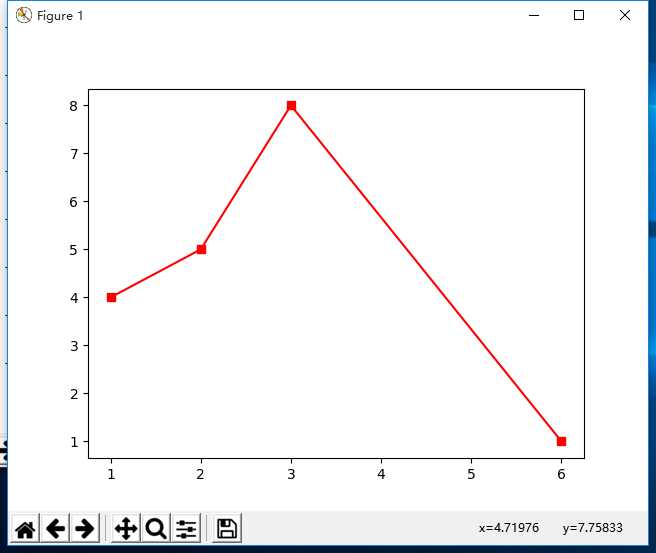
plt.plot([1,2,3,6],[4,5,8,1],’g-s’)
plt.show()
结果
**kwards:
color 颜色
linestyle 线条样式
marker 标记风格
markerfacecolor 标记颜色
markersize 标记大小 等等
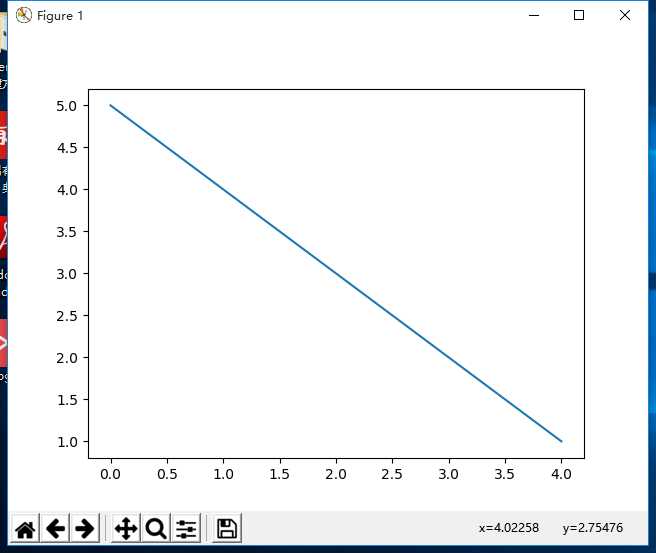
plt.plot([5,4,3,2,1])
plt.show()
结果
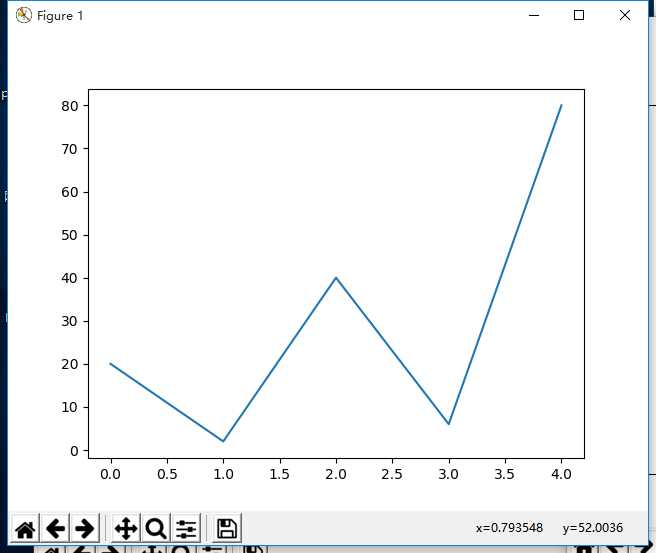
plt.plot([20,2,40,6,80]) #缺省x为[0,1,2,3,4,…]
plt.show()
结果
plt.plot()参数设置
Property Value Type
alpha 控制透明度,0为完全透明,1为不透明
animated [True False]
antialiased or aa [True False]
clip_box a matplotlib.transform.Bbox instance
clip_on [True False]
clip_path a Path instance and a Transform instance, a Patch
color or c 颜色设置
contains the hit testing function
dash_capstyle [‘butt’ ‘round’ ‘projecting’]
dash_joinstyle [‘miter’ ‘round’ ‘bevel’]
dashes sequence of on/off ink in points
data 数据(np.array xdata, np.array ydata)
figure 画板对象a matplotlib.figure.Figure instance
label 图示
linestyle or ls 线型风格[‘-’ ‘–’ ‘-.’ ‘:’ ‘steps’ …]
linewidth or lw 宽度float value in points
lod [True False]
marker 数据点的设置[‘+’ ‘,’ ‘.’ ‘1’ ‘2’ ‘3’ ‘4’]
markeredgecolor or mec any matplotlib color
markeredgewidth or mew float value in points
markerfacecolor or mfc any matplotlib color
markersize or ms float
markevery [ None integer (startind, stride) ]
picker used in interactive line selection
pickradius the line pick selection radius
solid_capstyle [‘butt’ ‘round’ ‘projecting’]
solid_joinstyle [‘miter’ ‘round’ ‘bevel’]
transform a matplotlib.transforms.Transform instance
visible [True False]
xdata np.array
ydata np.array
zorder any number
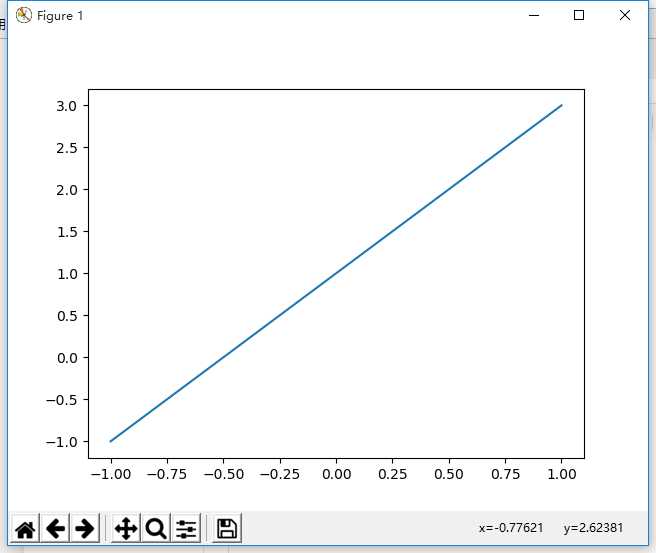
确定x,y值,将其打印出来
x=np.linspace(-1,1,5)
y=2*x+1
plt.plot(x,y)
plt.show()
2、plt.figure()用来画图,自定义画布大小
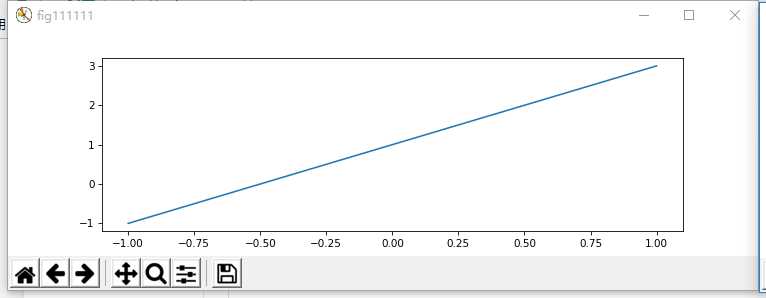
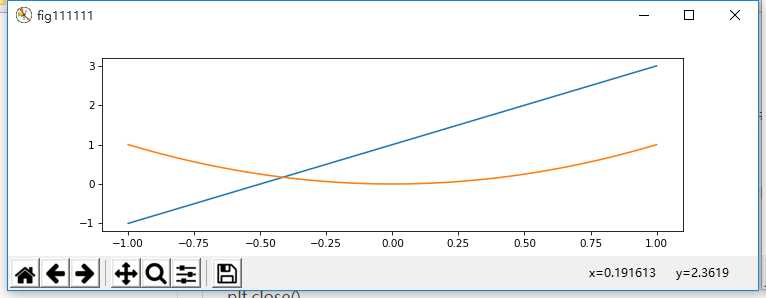
fig1 = plt.figure(num=’fig111111′, figsize=(10, 3), dpi=75, facecolor=’#FFFFFF’, edgecolor=’#0000FF’)
plt.plot(x,y1) #在变量fig1后进行plt.plot操作,图形将显示在fig1中
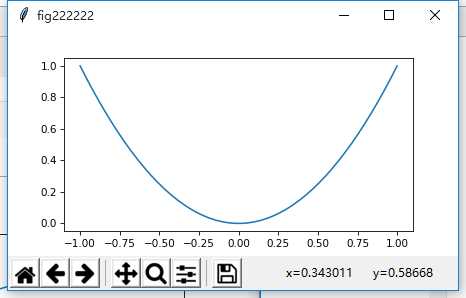
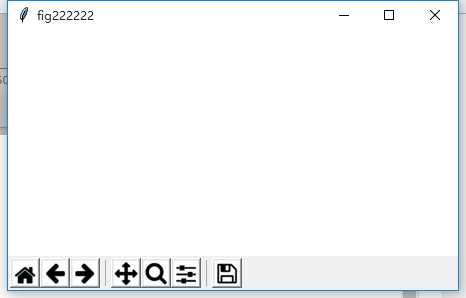
fig2 = plt.figure(num=’fig222222′, figsize=(6, 3), dpi=75, facecolor=’#FFFFFF’, edgecolor=’#FF0000′)
plt.plot(x,y2) #在变量fig2后进行plt.plot操作,图形将显示在fig2中
plt.show()
plt.close()
结果
fig1 = plt.figure(num=’fig111111′, figsize=(10, 3), dpi=75, facecolor=’#FFFFFF’, edgecolor=’#0000FF’)
plt.plot(x,y1)
plt.plot(x,y2)
fig2 = plt.figure(num=’fig222222′, figsize=(6, 3), dpi=75, facecolor=’#FFFFFF’, edgecolor=’#FF0000′)
plt.show()
plt.close()
结果:
3、plt.subplot(222)
将figure设置的画布大小分成几个部分,参数‘221’表示2(row)x2(colu),即将画布分成2×2,两行两列的4块区域,1表示选择图形输出的区域在第一块,图形输出区域参数必须在“行x列”范围 ,此处必须在1和2之间选择——如果参数设置为subplot(111),则表示画布整个输出,不分割成小块区域,图形直接输出在整块画布上
plt.subplot(222)
plt.plot(y,xx) #在2×2画布中第二块区域输出图形
plt.show()
plt.subplot(223) #在2×2画布中第三块区域输出图形
plt.plot(y,xx)
plt.subplot(224) # 在在2×2画布中第四块区域输出图形
plt.plot(y,xx)
4、plt.xlim设置x轴或者y轴刻度范围
如
plt.xlim(0,1000) # 设置x轴刻度范围,从0~1000 #lim为极限,范围
plt.ylim(0,20) # 设置y轴刻度的范围,从0~20
5、plt.xticks():设置x轴刻度的表现方式
fig2 = plt.figure(num=’fig222222′, figsize=(6, 3), dpi=75, facecolor=’#FFFFFF’, edgecolor=’#FF0000′)
plt.plot(x,y2)
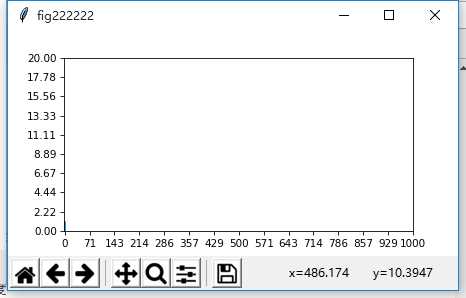
plt.xticks(np.linspace(0,1000,15,endpoint=True)) # 设置x轴刻度
plt.yticks(np.linspace(0,20,10,endpoint=True))
结果
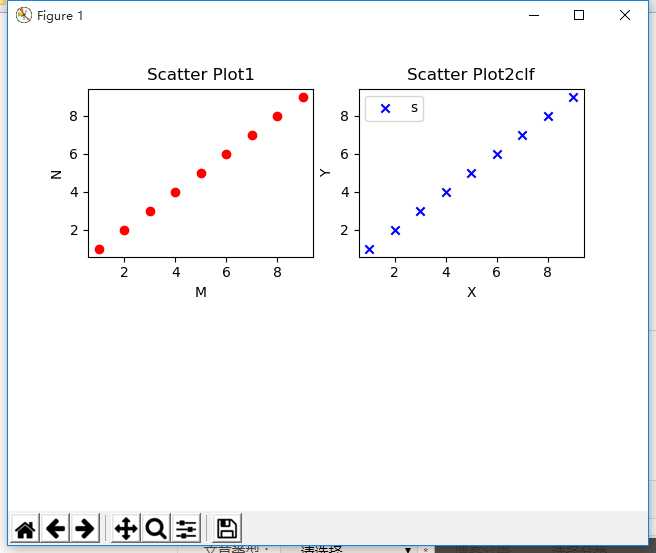
6、ax2.set_title(‘xxx’)设置标题,画图
#产生[1,2,3,…,9]的序列
x = np.arange(1,10)
y = x
fig = plt.figure()
ax1 = fig.add_subplot(221)
#设置标题
ax1.set_title(‘Scatter Plot1’)
plt.xlabel(‘M’)
plt.ylabel(‘N’)
ax2 = fig.add_subplot(222)
ax2.set_title(‘Scatter Plot2clf’)
#设置X轴标签
plt.xlabel(‘X’) #设置X/Y轴标签是在对应的figure后进行操作才对应到该figure
#设置Y轴标签
plt.ylabel(‘Y’)
#画散点图
ax1.scatter(x,y,c = ‘r’,marker = ‘o’) #可以看出画散点图是在对figure进行操作
ax2.scatter(x,y,c = ‘b’,marker = ‘x’)
#设置图标
plt.legend(‘show picture x1 ‘)
#显示所画的图
plt.show()
结果
7、plt.hist()绘制直方图(可以将高斯函数这些画出来)
绘图都可以调用matplotlib.pyplot库来进行,其中的hist函数可以直接绘制直方图
调用方式:
n, bins, patches = plt.hist(arr, bins=10, normed=0, facecolor=’black’, edgecolor=’black’,alpha=1,histtype=’bar’)
hist的参数非常多,但常用的就这六个,只有第一个是必须的,后面四个可选
arr: 需要计算直方图的一维数组
bins: 直方图的柱数,可选项,默认为10
normed: 是否将得到的直方图向量归一化。默认为0
facecolor: 直方图颜色
edgecolor: 直方图边框颜色
alpha: 透明度
histtype: 直方图类型,‘bar’, ‘barstacked’, ‘step’, ‘stepfilled’
返回值 :
n: 直方图向量,是否归一化由参数normed设定
bins: 返回各个bin的区间范围
patches: 返回每个bin里面包含的数据,是一个list
from skimage import data
import matplotlib.pyplot as plt
img=data.camera()
plt.figure(“hist”)
arr=img.flatten()
n, bins, patches = plt.hist(arr, bins=256, normed=1,edgecolor=’None’,facecolor=’red’)
plt.show()
例:
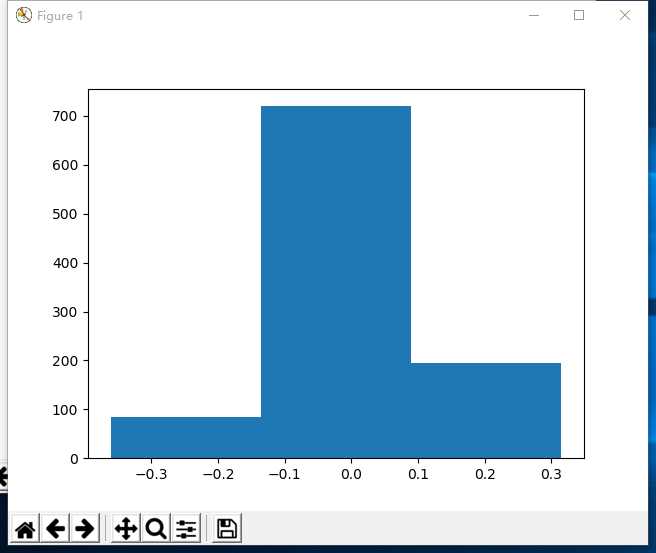
mu, sigma = 0, .1
s = np.random.normal(loc=mu, scale=sigma, size=1000)
a,b,c = plt.hist(s, bins=3)
print(“a: “,a)
print(“b: “,b)
print(“c: “,c)
plt.show()
结果:
a: [ 85. 720. 195.] #每个柱子的值
b: [-0.36109509 -0.1357318 0.08963149 0.31499478] #每个柱的区间范围
c: <a list of 3 Patch objects> #总共多少柱子
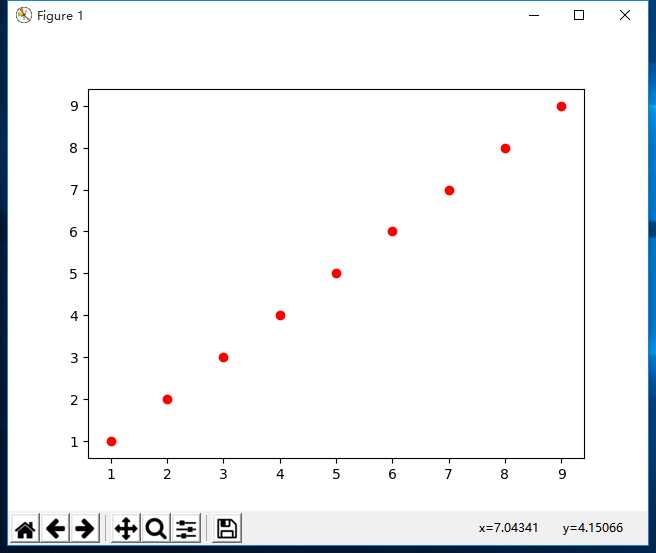
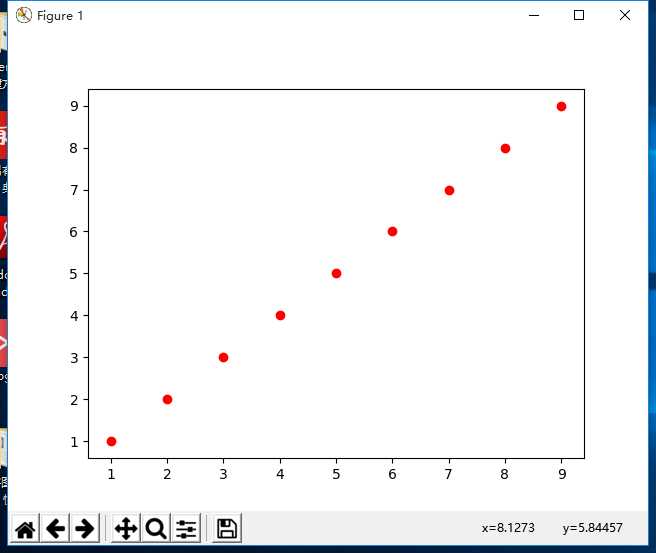
8、ax1.scatter(x,y,c = ‘r’,marker = ‘o’)
使用注意:确定了figure就一定要确定象限,然后用scatter,或者不确定象限,直接使用plt.scatter
x = np.arange(1,10)
y = x
fig = plt.figure()
a=plt.subplot() #默认为一个象限
# a=fig.add_subplot(222)
a.scatter(x,y,c=’r’,marker=’o’)
plt.show()
结果
x = np.arange(1,10)
y = x
plt.scatter(x,y,c=’r’,marker=’o’)
plt.show()
结果
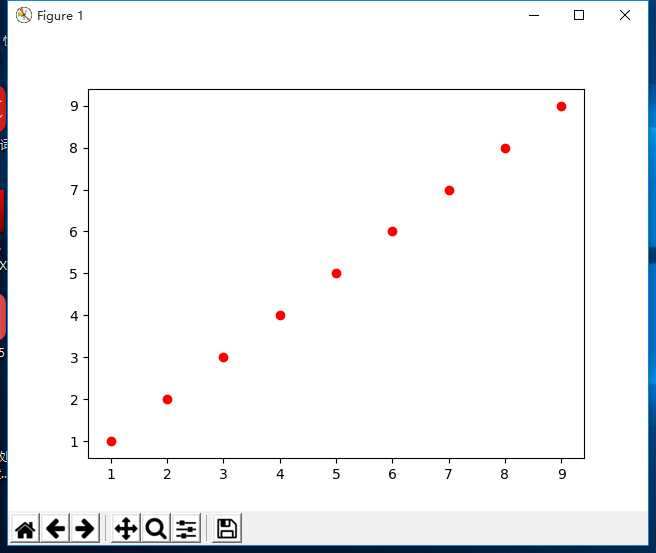
import numpy as np
import matplotlib.pyplot as plt
x = np.arange(1,10)
y = x
plt.figure()
plt.scatter(x,y,c=’r’,marker=’o’)
plt.show()
结果
今天的文章python中plot函数用法_python中plt.plot分享到此就结束了,感谢您的阅读。
版权声明:本文内容由互联网用户自发贡献,该文观点仅代表作者本人。本站仅提供信息存储空间服务,不拥有所有权,不承担相关法律责任。如发现本站有涉嫌侵权/违法违规的内容, 请发送邮件至 举报,一经查实,本站将立刻删除。
如需转载请保留出处:https://bianchenghao.cn/75565.html

