
X-R控制图
简介
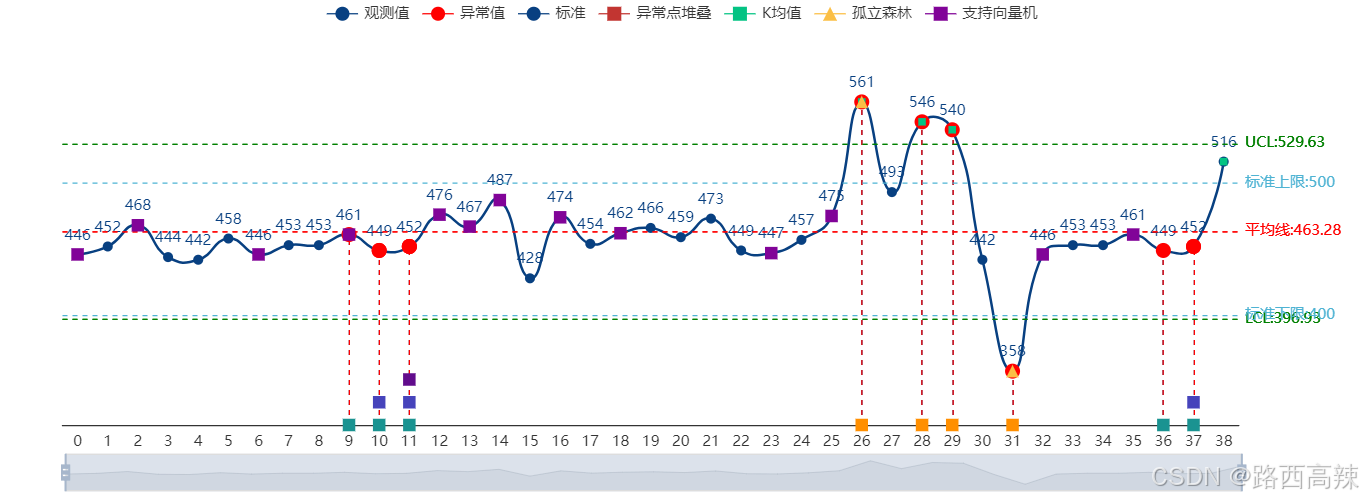
控制图(Control Chart)又叫管制图,是对过程质量特性进行测定、记录、评估,从而监察过程是否处于控制状态的一种用统计方法设计的图。图上有三条平行于横轴的直线:中心线(CL,Central Line)、上控制限(UCL,Upper Control Limit)和下控制限(LCL,Lower Control Limit),并有按时间顺序抽取的样本统计量数值的描点序列。UCL、CL、LCL统称为控制限(Control Limit),通常控制界限设定在±3标准差的位置。中心线是所控制的统计量的平均值,上下控制界限与中心线相距数倍标准差。若控制图中的描点落在UCL与LCL之外或描点在UCL和LCL之间的排列不随机,则表明过程异常
X-R控制图样例1
使用Echarts绘制
在echarts中要绘制这种控制图,需要用到主要以下几个配置项
- markLine:用于绘制标准类似标准上限、平均值和异常值连接横坐标的虚线
- markPoint:用于绘制异常点堆叠和异常值点位
具体例子
option = {
    toolbox: {
    feature: {
    saveAsImage: {
    name: 'x-Bar R均值控制图' } } }, xAxis: {
    type: 'category', axisTick: false, data: [1, 2, 3, 4, 5, 6, 7, 8] }, tooltip: {
    trigger: 'item' }, grid: {
    right: '15%' }, dataZoom: [ {
    type: 'slider', show: true, }, {
    // 没有下面这块的话,只能拖动滚动条, // 鼠标滚轮在区域内不能控制外部滚动条 type: 'inside', // 滚轮是否触发缩放 zoomOnMouseWheel: true, // 鼠标滚轮触发滚动 moveOnMouseMove: false, moveOnMouseWheel: false } ], yAxis: {
    type: 'value', max: Math.max(...[820, 932, 901, 934, 1290, 1330, 1320, 820]) + 100, min: 0 }, legend: {
    show: true }, series: [ {
    name: '实测值', data: [820, 932, 901, 934, 1290, 1330, 1320, 820], type: 'line', label: {
    show: true }, tooltip: {
    trigger: 'item', formatter: '点位:{b}<br/>实测值:{c}' }, markLine: {
    symbol: 'none', lineStyle: {
    color: '#078307' }, tooltip:{
    }, data: [ {
    name: '平均线', type: 'average', lineStyle: {
    color: 'red' }, label: {
    color: 'red' } }, {
    name: 'LPL', yAxis: 200 }, {
    name: 'LCL', yAxis: 120 }, ], label: {
    formatter: '{b}:{c}', color: '#078307' } }, color: '#084081', smooth: true, symbolSize: 10, symbol: 'circle' }, {
    name: '异常值', markLine: {
    symbol: 'none', lineStyle: {
    color: '#078307' }, tooltip:{
    }, data: [ [ {
    lineStyle: {
    color: 'red' }, label:{
    show:false }, tooltip:{
    show:false }, coord: ['2', 0] }, {
    coord: ['2', 932] } ], [ {
    lineStyle: {
    color: 'red' }, label:{
    show:false }, tooltip:{
    show:false }, coord: ['3', 0] }, {
    coord: ['3', 901] } ] ], label: {
    // distance: [20, 8], formatter: '{b}:{c}', color: '#078307' } }, type: 'line', symbol: 'circle', symbolSize: 14, color: 'red', lineStyle: {
    // color:'#fff' // opacity: 0 }, smooth: true, markPoint: {
    tooltip: {
    formatter: '{b}' }, data: [ {
    name: '', coord: [1, 932], symbolSize: 14, symbol: 'circle' }, {
    name: '', coord: [2, 901], symbolSize: 14, symbol: 'circle' } ] } }, {
    name: '标准值', symbol: 'circle', color: '#084081', type: 'line', markLine: {
    lineStyle: {
    color: '#4eb3d3' }, // silent:true, symbol: 'none', data: [ {
    name: '标准上限', yAxis: 500 }, {
    name: '标准下限', yAxis: 80 } ], label: {
    // distance: [20, 8], formatter: '{b}:{c}', color: '#4eb3d3' } } }, {
    name: '异常点堆叠', type: 'line', symbol: 'rect', color: '#d9001b', smooth: true, markPoint: {
    tooltip: {
    formatter: '{b}' }, data: [ {
    name: '1个点远离中心线超过3倍标准差', coord: [1, 20], symbolSize: 10, itemStyle: {
    color: '#ff8f00' }, symbol: 'rect' }, {
    name: '连续7个点在同一侧', coord: [2, 240], symbolSize: 10, itemStyle: {
    color: '#1a9391' }, symbol: 'rect' }, {
    name: '连续8个点在同一侧', coord: [2, 120], symbolSize: 10, itemStyle: {
    color: '#4643bb' }, symbol: 'rect' }, {
    name: '连续9个点在同一侧', coord: [3, 360], symbolSize: 10, itemStyle: {
color: '#610c8c' }, symbol: 'rect' } ] } } ] }; - SimpleSpc样例 ↩︎
版权声明:本文内容由互联网用户自发贡献,该文观点仅代表作者本人。本站仅提供信息存储空间服务,不拥有所有权,不承担相关法律责任。如发现本站有涉嫌侵权/违法违规的内容, 请发送邮件至 举报,一经查实,本站将立刻删除。
如需转载请保留出处:https://bianchenghao.cn/bian-cheng-ji-chu/98912.html