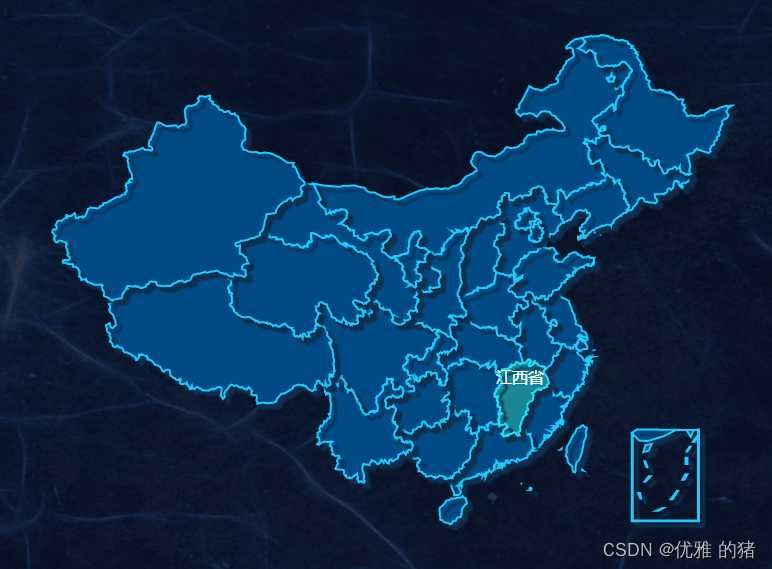
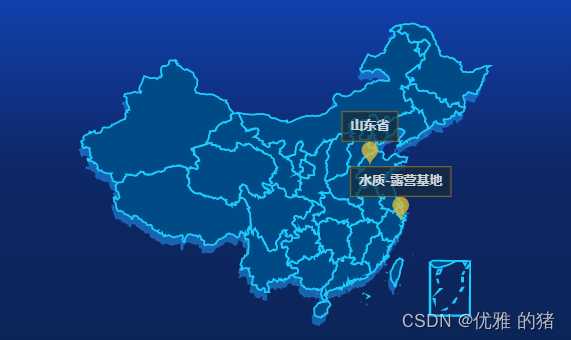
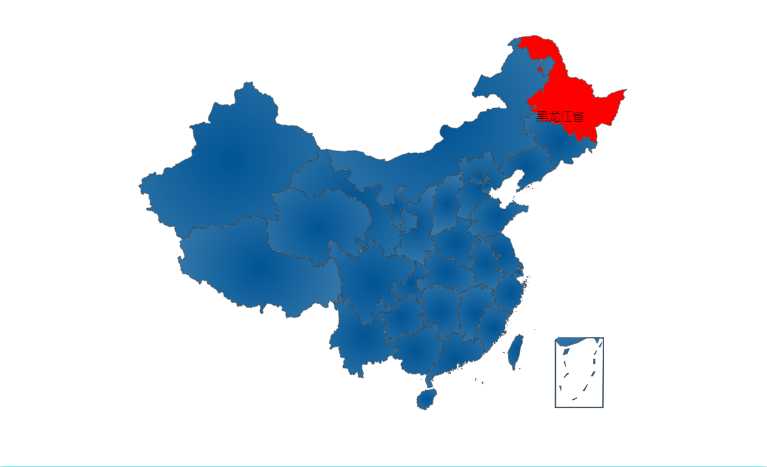
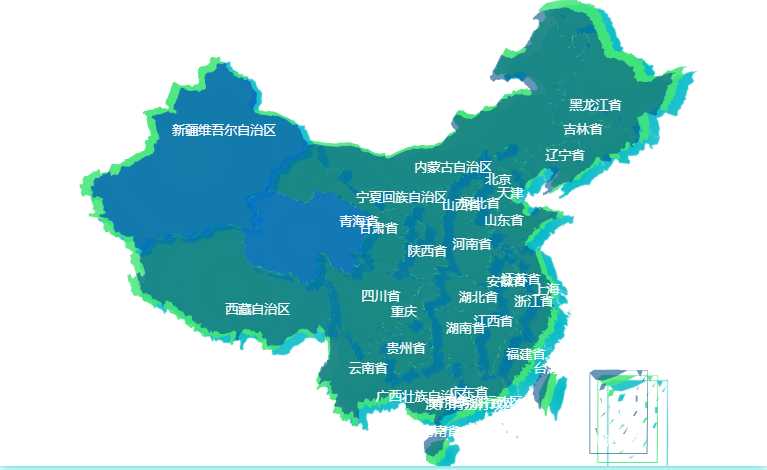
地图比普通的echarts多了一步 需要注册,就是要引入某个地区的json文件
各个地区的json文件链接 数据可视化平台(各个地区的json文件)
实例1 (Vue2写法)
为地图添加阴影,增加立体感
<template>
  <div :id="id" style="width: 100%; height: 100%;position: absolute;top: 0;left: 0;z-index: 999;"></div>
</template>
<script>
import { fontChart } from "@/utils/echartPxToRem";
import { cityMap } from "@/utils/china-main-city-map.js";
import * as echarts from "echarts";
export default {
  data() {
    return {
      charts: ""
    };
  },
  props: {
    id: {
      type: String,
      required: true,
    },
    cityName: {
      type: String,
      required: true
    }
  },
  watch: {
    cityName() {
      this.LoadMap()
    }
  },
  mounted() {
    this.LoadMap();
  },
  destroyed() {
    window.removeEventListener("resize", this.selfAdaption);
  },
  methods: {
    LoadMap() {
      this.charts = echarts.init(document.getElementById(this.id));
      const jsonCode = require("../../../../../assets/map/" + cityMap[this.cityName] + ".json");
      echarts.registerMap(this.cityName, jsonCode);
      let option = {
        // backgroundColor: "black",
        geo: {
          show: false,
          map: this.cityName,
          aspectScale: 0.8,
          layoutCenter: ["50%", "50%"],
          // roam: true, //是否开启平游或缩放
          // scaleLimit: {
          //   //滚轮缩放的极限控制
          //   min: 0.5,
          //   max: 1.2,
          // },
          layoutSize: this.cityName == '全国'? "120%" : "98%",
          itemStyle: {
            areaColor: {
              type: "linear-gradient",
              x: 0,
              y: 1200,
              x2: 1000,
              y2: 0,
              colorStops: [
                {
                  offset: 0,
                  color: "#152E6E", // 0% 处的颜色
                },
                {
                  offset: 1,
                  color: "#0673AD", // 50% 处的颜色
                },
              ],
              global: true, // 缺省为 false
            },
            shadowColor: "#229ffc",
            shadowOffsetX: -2,
            shadowOffsetY: 8,
            opacity: 0.5,
          },
          emphasis: {
            label: { show: false },
            areaColor: "red",
          },
          regions: [
            {
              name: "南海诸岛",
              itemStyle: {
                areaColor: "rgba(0, 10, 52, 1)",
                borderColor: "rgba(0, 10, 52, 1)",
                opacity: 0,
                label: {
                  show: false,
                  color: "#009cc9",
                },
              },
              label: {
                show: false,
                color: "#FFFFFF",
                fontSize: 12,
              },
            },
          ],
        },
        series: [
          {
            type: "map",
            selectedMode: "multiple",
            map: this.cityName,
            aspectScale: 0.8,
            layoutCenter: ["50%", "50%"], //地图位置
            layoutSize: this.cityName == '全国'? "120%" : "98%",
            zoom: 1, //当前视角的缩放比例
            roam: 'move', //是否开启平游或缩放
            // scaleLimit: {
            //   //滚轮缩放的极限控制
            //   min: 0.5,
            //   max: 1.2,
            // },
            label: {
              show: false,
              color: "#FFFFFF",
              fontSize: 16,
            },
            itemStyle: { // 为地图添加阴影,增加立体感
              areaColor: "#004b85",
              borderColor: "#1cccff",
              // borderWidth: 1.8,
              borderWidth:2,
              shadowBlur:2,
              shadowColor:'#0e2f50',
              shadowOffsetX:5,
              shadowOffsetY:10,
            },
            emphasis: {
              //是图形在高亮状态下的样式,比如在鼠标悬浮或者图例联动高亮时
              label: {
                show: true,
                color: '#fff'
              },
              itemStyle: {
                areaColor: "#198895",
              },
            },
            data: [
              {
                name: "江西省",
                // itemStyle: {
                //   areaColor: "red",
                // },
                selected: true,
                // value: 22,
              }
            ]
          },
          // 添加散点 标记点
          {
            type: "scatter",
            coordinateSystem: "geo",
            symbol: "pin",
            legendHoverLink: true,
            symbolSize: [28, 28],
            // legendHoverLink: true,
            label: {
              show: true,
              offset: [0, -25], //偏移设置
              fontSize: fontChart(15),
              lineHeight: fontChart(13),
              borderWidth: 1,
              backgroundColor: "rgba(20, 43, 61, .9)",
              borderColor: "#8f7136",
              padding: fontChart(8),
              formatter(value) {
                // console.log(value,'value-->>');
                // return value.data.name + ':' + value.data.value[2] + '人'
                // return `{name|${value.data.name}}\nph值:{pt|${value.data.ph}}\n溶解氧:{pt|${value.data.rjy}}\n{date|更新时间:${value.data.upDate}}`;
                return `{name|${value.data.name}}`
              },
              rich: {
                name: {
                  fontWeight: "bold",
                  fontSize: fontChart(13),
                  color: "#fff",
                },
                pt: {
                  fontSize: 14,
                  color: "#2BD8FB",
                },
                date: {
                  color: "rgb(255,255,255,0.8)",
                },
              },
              color: "#fff",
            },
            itemStyle: {
              color: "#D8BC37", //标志颜色
              shadowBlur: 2,
              shadowColor: "D8BC37"
            },
            // data: [  // 数据
            //   {
            //     name: '水质-露营基地',
            //     value: [121.645189, 29.750277],
            //     ph: 7.7,
            //     rjy: 9.32,
            //     upDate: '11-09 11:45',
            //   },
            //   {
            //     name: '山东省',
            //     value: [117.00, 36.40],
            //     ph: 7.7,
            //     rjy: 9.32,
            //     upDate: '11-09 11:45',
            //   },
            // ],
            showEffectOn: "render",
            rippleEffect: {
              brushType: "stroke",
            },
            // hoverAnimation: true,
            zlevel: 1,
          }
        ]
      }
      // 这里很重要!!解决重复点击
      this.charts.off('click')
      this.charts.setOption(option, true);
      this.charts.on("click", (params) => { // 下钻
        this.$emit('mapClick', params.name)
      });
      window.addEventListener("resize", this.selfAdaption);
    },
    // 自适应
    selfAdaption() {
      if (!this.charts) return;
      this.charts.resize();
      this.LoadMap();
    }
  }
}
</script>
实例2 (Vue2写法)
<template>
  <div :id="id" style="width: 100%; height: 100%"></div>
</template>
<script>
import { fontChart } from "@/utils/echartPxToRem";
import { cityMap } from "@/utils/china-main-city-map.js";
import * as echarts from "echarts";
export default {
  data() {
    return {
      charts: "",
    };
  },
  props: {
    id: {
      type: String,
      required: true,
    },
  },
  computed: {
    cityname: () => process.env.VUE_APP_CITY_NAME,
  },
  // watch: {
  //   yValue() {
  //     this.LoadMap();
  //   },
  // },
  mounted() {
    this.LoadMap();
  },
  destroyed() {
    window.removeEventListener("resize", this.selfAdaption);
  },
  methods: {
    LoadMap() {
      this.charts = echarts.init(document.getElementById(this.id));
      const jsonCode = require("../../../../../assets/map/" + cityMap[this.cityname] + ".json");
      echarts.registerMap("china", jsonCode);
      let option = {
        // backgroundColor: "black",
        geo: {
          map: "china",
          aspectScale: 0.8,
          layoutCenter: ["50%", "50%"],
          layoutSize: "120%",
          itemStyle: {
            normal: {
              areaColor: {
                type: "linear-gradient",
                x: 0,
                y: 1200,
                x2: 1000,
                y2: 0,
                colorStops: [
                  {
                    offset: 0,
                    color: "#152E6E", // 0% 处的颜色
                  },
                  {
                    offset: 1,
                    color: "#0673AD", // 50% 处的颜色
                  },
                ],
                global: true, // 缺省为 false
              },
              shadowColor: "#229ffc",
              shadowOffsetX: -2,
              shadowOffsetY: 8,
              opacity: 0.5,
            },
            emphasis: {
              areaColor: "#0f5d9d",
            },
          },
          regions: [
            {
              name: "南海诸岛",
              itemStyle: {
                areaColor: "rgba(0, 10, 52, 1)",
                borderColor: "rgba(0, 10, 52, 1)",
                normal: {
                  opacity: 0,
                  label: {
                    show: false,
                    color: "#009cc9",
                  },
                },
              },
              label: {
                show: false,
                color: "#FFFFFF",
                fontSize: 12,
              },
            },
          ],
        },
        series: [
          {
            type: "map",
            selectedMode: "multiple",
            mapType: "china",
            aspectScale: 0.8,
            layoutCenter: ["50%", "50%"], //地图位置
            layoutSize: "120%",
            zoom: 1, //当前视角的缩放比例
            // roam: true, //是否开启平游或缩放
            scaleLimit: {
              //滚轮缩放的极限控制
              min: 1,
              max: 2,
            },
            label: {
              show: false,
              color: "#FFFFFF",
              fontSize: 16,
            },
            itemStyle: {
              normal: {
                areaColor: "#004b85",
                borderColor: "#1cccff",
                borderWidth: 1.8,
              },
              emphasis: {
                areaColor: "#198895",
                label: {
                  show: true,
                  color: "#fff",
                  fontSize: fontChart(12),
                },
              },
            },
            data: [
              {
                name: "内蒙古",
                // itemStyle: {
                //   areaColor: "#56b1da",
                // },
                value: [110.3467, 41.4899],
              },
            ],
          },
          {
            type: "scatter",
            coordinateSystem: "geo",
            symbol: "pin",
            legendHoverLink: true,
            symbolSize: [28, 28],
            // legendHoverLink: true,
            label: {
              show: true,
              offset: [0, -25], //偏移设置
              fontSize: fontChart(15),
              lineHeight: fontChart(13),
              borderWidth: 1,
              backgroundColor: "rgba(20, 43, 61, .9)",
              borderColor: "#8f7136",
              padding: fontChart(8),
              formatter(value) {
                console.log(value,'value-->>');
                // return value.data.name + ':' + value.data.value[2] + '人'
                // return `{name|${value.data.name}}\nph值:{pt|${value.data.ph}}\n溶解氧:{pt|${value.data.rjy}}\n{date|更新时间:${value.data.upDate}}`;
                return `{name|${value.data.name}}`
              },
              rich: {
                name: {
                  fontWeight: "bold",
                  fontSize: fontChart(13),
                  color: "#fff",
                },
                pt: {
                  fontSize: 14,
                  color: "#2BD8FB",
                },
                date: {
                  color: "rgb(255,255,255,0.8)",
                },
              },
              color: "#fff",
            },
            itemStyle: {
              normal: {
                color: "#D8BC37", //标志颜色
                shadowBlur: 2,
                shadowColor: "D8BC37",
              },
            },
            data: [  // 数据
              {
                name: '水质-露营基地',
                value: [121.645189, 29.750277],
                ph: 7.7,
                rjy: 9.32,
                upDate: '11-09 11:45',
              },
              {
                name: '山东省',
                value: [117.00, 36.40],
                ph: 7.7,
                rjy: 9.32,
                upDate: '11-09 11:45',
              },
            ],
            showEffectOn: "render",
            rippleEffect: {
              brushType: "stroke",
            },
            hoverAnimation: true,
            zlevel: 1,
          },
        ],
      };
      this.charts.setOption(option);
      this.charts.on("click", (params) => {
        console.log(params, "params--->>");
      });
      window.addEventListener("resize", this.selfAdaption);
    },
    // 自适应
    selfAdaption() {
      if (!this.charts) return;
      this.charts.resize();
      this.LoadMap();
    },
  },
};
</script>
示例2(Vue3写法)
<template>
  <div :id="id" style="width: 100%;height: 100%;"></div>
</template>
<script setup>
import * as echarts from "echarts";
import { fontChart } from "@/utils/echartPxToRem.js";
import chinaJson from "@/assets/map/100000.json";   //  引入某个地区所需要的json文件
import { onMounted } from "vue";

const props = defineProps({
  id: {
    type: String,
    required: true,
  },
});

let charts = "";

onMounted(() => {
  loadMap();
});

const loadMap = () => {
  charts = echarts.init(document.getElementById(props.id));
  echarts.registerMap("china", chinaJson); // 注册
  let option = {
    // backgroundColor: 'rgb(1,30,64)', // 背景
    title: {
      show: false,
      //标题样式
      text: "ECharts 中国地图",
      x: "center",
      textStyle: {
        fontSize: fontChart(18),
        color: "red",
      },
    },
    tooltip: {
      show: true,
      //这里设置提示框
      trigger: "item", //数据项图形触发
      // triggerOn: 'click', //mousemove、click、mousemove|click、none
      backgroundColor: "#fff", //提示框浮层的背景颜色。
      //字符串模板(地图): {a}(系列名称),{b}(区域名称),{c}(合并数值),{d}(无)
      // formatter: "地区:{b}<br/>模拟数据:{c}",
      formatter: params => {
        return params
      }
    },
    visualMap: {
      //视觉映射组件
      show: false,
      top: "bottom",
      left: "left",
      min: 10,
      max: 500000,
      text: ["High", "Low"],
      realtime: false, //拖拽时,是否实时更新
      calculable: true, //是否显示拖拽用的手柄
      inRange: {
        color: ["red", "yellow", "blue"],
      },
    },
    series: [
      {
        name: "china",
        type: "map",
        map: "china",
        roam: false, //是否开启鼠标缩放和平移漫游
        zoom: 1, //地图缩放比例,默认为1
        itemStyle: {
          //地图区域的多边形 图形样式
          areaColor: {
            type: "radial",
            x: 0.5,
            y: 0.5,
            r: 0.8,
            colorStops: [
              {
                offset: 0,
                color: "rgba(0, 84, 148, 1)", // 0% 处的颜色
                // color: 'rgba(147, 235, 248, 0)' // 0% 处的颜色
              },
              {
                offset: 1,
                color: "rgba(0, 84, 148, .8)", // 100% 处的颜色
                // color: 'rgba(147, 235, 248, .2)' // 100% 处的颜色
              },
            ],
            globalCoord: false, // 缺省为 false
          },
        },
        //是图形在默认状态下的样式
        label: {
          normal: {
            show: false,
            formatter:"{b}",
            position:'right',
            textStyle: {
              color: "black",
            }
          }
        },
        markPoint: { //图标标注 点标记
          label: {
            normal: {
              show: true,
              formatter: function(params) { //标签内容       如果只显示图片则隐藏
                return params.name;
              },
            },
          },
          itemStyle: {
            normal: {
              color: 'none'
            },
          },
          data: [
            {
              name: "四川移动",
              coord: [
                108.393982, 31.175037 //坐标,通过高德
              ],
              selected: false,
              symbol: 'image://https://img1.baidu.com/it/u=777884207,2018784782&fm=26&fmt=auto&gp=0.jpg', // 标注图片地址路径
              symbolSize: 20,
            },
            {
              name: "河南电信",
              coord: [
                108.391429, 31.177332
              ],
              selected: false,
              symbol: 'image://https://img1.baidu.com/it/u=777884207,2018784782&fm=26&fmt=auto&gp=0.jpg', // 标注图片地址路径
              symbolSize: 20,
            }
          ]
        },
        emphasis: {
          //是图形在高亮状态下的样式,比如在鼠标悬浮或者图例联动高亮时
          label: { show: true },
          itemStyle: {
            areaColor: "#f6ac13",
          },
        },
        top: "8%", //组件距离容器的距离
        // left: '10%',
        data: [
          //  数据的展示(颜色) 一般搭配视觉映射组件visualMap
          // { name: "北京", value: 275005 },
          // { name: "四川省", value: 480000 },
          // { name: "青海省", value: 400000 },
          // { name: "内蒙古自治区", value: 10000 },
        ],
      },
    ],
  };
  charts.setOption(option);
  window.addEventListener("resize", selfAdaption);
};

// 自适应
function selfAdaption() {
  if (!charts) return;
  charts.resize();
  loadMap();
}
</script>
示例3(Vue3写法)
<template>
  <div :id="id" style="width: 100%; height: 100%"></div>
</template>
<script setup>
import * as echarts from "echarts";
import { fontChart } from "@/utils/echartPxToRem.js";
import chinaJson from "@/assets/map/100000.json";  // 引入某个地区所需要的json文件
import { onMounted } from "vue";

const props = defineProps({
  id: {
    type: String,
    required: true,
  },
});

let charts = "";

onMounted(() => {
  loadMap();
});

const loadMap = () => {
  charts = echarts.init(document.getElementById(props.id));
  echarts.registerMap("china", chinaJson); // 注册
  let option = {
    tooltip: {
      show: true,
      textStyle: {
        fontSize: fontChart(12),
      },
      formatter: (params) => {
        if (params.data)
          // return params.name + ":" + params.data["showValue"];
          return "哈哈哈";
      },
    },
    geo: {
      map: 'china',
      roam: false,
      layoutCenter: ["50%", "50%"],
      layoutSize: "100%",
      show: true,
      zoom: 1.3,
      // itemStyle: {
      //   normal: {
      //     // areaColor: "#15e3c9",
      //     shadowColor: "rgba(0,243,255,0.6)",
      //     shadowOffsetX: 9,
      //     shadowOffsetY: 9,
      //     areaColor: {
      //       type: "radial",
      //       x: 0.5,
      //       y: 0.5,
      //       r: 0.8,
      //       colorStops: [
      //         {
      //           offset: 0,
      //           color: "rgba(66, 229, 119, 1)", // 0% 处的颜色
      //           // color: 'rgba(147, 235, 248, 0)' // 0% 处的颜色
      //         },
      //         {
      //           offset: 1,
      //           color: "rgba(66, 229, 119, .8)", // 100% 处的颜色
      //           // color: 'rgba(147, 235, 248, .2)' // 100% 处的颜色
      //         },
      //       ],
      //       globalCoord: false, // 缺省为 false
      //     },
      //   },
      //   emphasis: {
      //     areaColor: "#2AB8FF",
      //     borderWidth: 0,
      //     color: "green",
      //     label: {
      //       show: false,
      //     },
      //   },
      // },
      itemStyle: {
        normal: {
          areaColor: {
            type: "radial",
            x: 0.5,
            y: 0.5,
            r: 0.8,
            colorStops: [
              {
                offset: 0,
                color: "rgba(66, 229, 119, 1)", // 0% 处的颜色
                // color: 'rgba(147, 235, 248, 0)' // 0% 处的颜色
              },
              {
                offset: 1,
                color: "rgba(66, 229, 119, .8)", // 100% 处的颜色
                // color: 'rgba(147, 235, 248, .2)' // 100% 处的颜色
              },
            ],
            globalCoord: false, // 缺省为 false
          },
          borderWidth: fontChart(0), //设置外层边框
          borderColor: "#2157aa", //外层边框颜色
          shadowOffsetX: "10", //阴影X偏移量
          shadowOffsetY: "5", //阴影Y偏移量
          shadowColor: "#00b9c5", // 阴影颜色
          shadowBlur: 1,
          opacity: "1", //阴影图形透明度
        },
        emphasis: {
          show: false,
          areaColor: "red",
        },
      },
    },
    series: [
      {
        name: "MAP",
        type: "map",
        mapType: 'china',
        layoutCenter: ["40%", "38%"], // position位置
        zoom: 1.2,
        selectedMode: "single", //是否允许选中多个区域
        regions: [
          {
            name: "南海诸岛",
            value: 0,
            itemStyle: {
              normal: {
                opacity: 0,
                label: {
                  show: false,
                },
              },
            },
          },
        ],
        label: {
          normal: {
            show: true,
            fontSize: fontChart(13),
            color: "#fff",
          },
          emphasis: {
            show: true,
            textStyle: { color: "#FFFFFF" },
          },
        },
        itemStyle: {
          normal: {
            areaColor: "rgba(1, 77, 139,.6)", //地图区域颜色
            borderColor: "#05c9d5", //地图边框颜色
            borderWidth: "0",
          },
          emphasis: {
            // areaColor: "#005497",
            areaColor: "#0f72fc", // 鼠标移入区域颜色
          },
        },
        data: [
          {
            value: 100,
            // longitude: 106.881862,
            // latitude: 29.805519
          },
        ],
      },
      // {
      //   type: "effectScatter",
      //   coordinateSystem: "geo",
      //   showEffectOn: "render",
      //   zlevel: 1,
      //   rippleEffect: {
      //     period: 6,
      //     scale: 3,
      //     // brushType: 'fill'
      //   },
      //   hoverAnimation: true,
      //   label: {
      //     normal: {
      //       formatter: function (params) {
      //         //圆环显示文字
      //         return params.data.name;
      //       },
      //       fontSize: 16,
      //       position: "right",
      //       offset: [15, 0],
      //       color: "#fff",
      //       show: true,
      //     },
      //   },
      //   itemStyle: {
      //     normal: {
      //       color: "#fff",
      //       shadowBlur: 20,
      //     },
      //   },
      //   symbolSize: 10,
      //   data: [
      //     {
      //       value: [118.8062, 31.9208],
      //       itemStyle:{color:'red'},
      //       name:"浙江能源"
      //     },
      //     {
      //       value: [119.09648,40.058726],
      //       itemStyle:{
      //         color:'red'
      //       },
      //       name:"北方港"
      //     },
      //     {
      //       value: [100.846362,55.254671],
      //       itemStyle:{
      //         color:'red'
      //       },
      //       name:"俄罗斯"
      //     }
      //   ],
      // }
      {
        type: "scatter", //配置显示方式为用户自定义
        coordinateSystem: "geo",
        data: [
          // 点
          {
            value: [100.846362, 55.254671],
            itemStyle: {
              emphasis: {
                shadowBlur: 20,
                shadowOffsetX: 20,
                shadowColor: "rgba(1, 210, 255, 0.5)",
                labelLine: { show: true },
                label: {
                  show: true,
                  formatter: "{b} : {c} ({d}%)",
                },
              },
              color: {
                type: "linear",
                x: 0,
                y: 0,
                x2: 0,
                y2: 1,
                colorStops: [
                  {
                    offset: 0,
                    color: "#00d3ff", // 0% 处的颜色
                  },
                  {
                    offset: 1,
                    color: "#00d3ff", // 100% 处的颜色
                  },
                ],
                global: false, // 缺省为 false
              },
            },
            name: "dian-name",
          },
        ],
        // data: [
        //    {value: [106.881862, 29.805519],
        //     name: '显示信息'}
        // ],
        tooltip: {
          // 提示框组件
          show: true, // 显示提示框组件
          trigger: "item", // 触发类型
          triggerOn: "mousemove", // 出发条件
          formatter: function (params) {
            console.log(params);
            return "params";
          },
        },
      },
    ],
  };
  charts.setOption(option);
  window.addEventListener("resize", selfAdaption);
};

// 自适应
function selfAdaption() {
  if (!charts) return;
  charts.resize();
  loadMap();
}
</script>今天的文章echarts地图示例分享到此就结束了,感谢您的阅读,如果确实帮到您,您可以动动手指转发给其他人。
版权声明:本文内容由互联网用户自发贡献,该文观点仅代表作者本人。本站仅提供信息存储空间服务,不拥有所有权,不承担相关法律责任。如发现本站有涉嫌侵权/违法违规的内容, 请发送邮件至 举报,一经查实,本站将立刻删除。
如需转载请保留出处:https://bianchenghao.cn/25343.html


