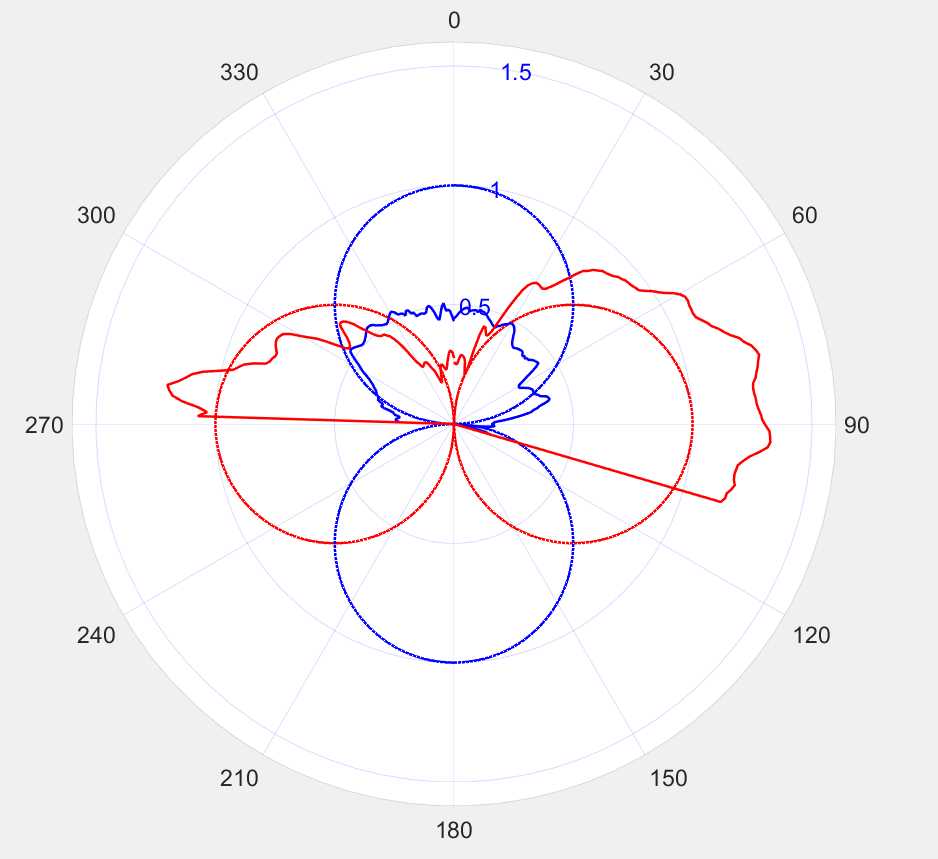
%%%%%%%%%%%%%%%%%%%%%%%%%%本脚本用于绘制方向图极坐标%%%%%%%%%%%%%%%%%%%%
%作者:
%编写时间:2022年03月
clc;clear;close all;
%%%%%%%%%%%%%%%%%%%%%%%%%%%%%各观测量原始数据提取%%%%%%%%%%%%%%%%%%%%%%%%%%%
 FileName=['MeasPatternValueFile','.txt'];
 FilePath='C:\Users\longrt\Desktop\';
 Direction_Data=importdata(fullfile(FilePath,FileName),' ');
 X1=Direction_Data(:,1);
 Y1=Direction_Data(:,2);
 X2=Direction_Data(:,3);
 Y2=Direction_Data(:,4);
 a = sqrt(X1.^2 + Y1.^2);
 b = sqrt(X2.^2 + Y2.^2);
 theta = linspace(0,2*pi);
 %绘制圆环
rho = sin(theta);
rho2= cos(theta);
polarplot(theta,rho,':r','LineWidth',1.5);
hold on;
polarplot(theta,-rho,':r','LineWidth',1.5);
hold on;
polarplot(theta,rho2,':b','LineWidth',1.5);
hold on;
polarplot(theta,-rho2,':b','LineWidth',1.5);
hold on;
 polarplot(a,'b','LineWidth',1.5);
 hold on;
 polarplot(b,'r','LineWidth',1.5);
 pax = gca;
 pax.ThetaDir = 'clockwise';
 pax.ThetaZeroLocation = 'top';     % 将0度放在顶部
 pax.FontSize = 14; %极坐标系字号大小
 rlim([0 1.6]);              % 设置半径范围
 rticks([0.5 1 1.5])		 % 在r=0.6、1.6、2处显示刻度
 pax.RColor = 'blue';        % 设置刻度的颜色
 pax.GridColor = 'b';        % 设置刻度线颜色
今天的文章Matlab绘制极坐标分享到此就结束了,感谢您的阅读,如果确实帮到您,您可以动动手指转发给其他人。
版权声明:本文内容由互联网用户自发贡献,该文观点仅代表作者本人。本站仅提供信息存储空间服务,不拥有所有权,不承担相关法律责任。如发现本站有涉嫌侵权/违法违规的内容, 请发送邮件至 举报,一经查实,本站将立刻删除。
如需转载请保留出处:https://bianchenghao.cn/33089.html

