数据是机器学习模型的原材料,当下机器学习的热潮离不开大数据的支撑。在机器学习领域,有大量的公开数据集可以使用,从几百个样本到几十万个样本的数据集都有。有些数据集被用来教学,有些被当做机器学习模型性能测试的标准(例如ImageNet图片数据集以及相关的图像分类比赛)。这些高质量的公开数据集为我们学习和研究机器学习算法提供了极大的便利,类似于模式生物对于生物学实验的价值。
Iris数据集概况
Iris Data Set(鸢尾属植物数据集)是我现在接触到的历史最悠久的数据集,它首次出现在著名的英国统计学家和生物学家Ronald Fisher 1936年的论文《The use of multiple measurements in taxonomic problems》中,被用来介绍线性判别式分析。在这个数据集中,包括了三类不同的鸢尾属植物:Iris Setosa,Iris Versicolour,Iris Virginica。每类收集了50个样本,因此这个数据集一共包含了150个样本。
特征
该数据集测量了所有150个样本的4个特征,分别是:
- sepal length(花萼长度)
- sepal width(花萼宽度)
- petal length(花瓣长度)
- petal width(花瓣宽度)
以上四个特征的单位都是厘米(cm)。
通常使用mm表示样本量的大小,nn表示每个样本所具有的特征数。因此在该数据集中,m=150,n=4m=150,n=4
数据集的获取
该数据集被广泛用于分类算法的示例中,很多机器学习相关的数据都对这个数据集进行了介绍,因此可以获得的途径应该也会很多。
下面是该数据集存放的原始位置,该位置好像已经无法下载了,但是收集了使用该数据集的论文列表可供参考:
https://archive.ics.uci.edu/ml/datasets/Iris/
另一个比较方便的获取方式是,直接利用Python中的机器学习包scikit-learn直接导入该数据集,可参考Iris Plants Database,下面是具体的操作:
1 from sklearn.datasets import load_iris
2 data = load_iris()
3 print(dir(data))  # 查看data所具有的属性或方法
4 print(data.DESCR)  # 查看数据集的简介
5
6
7 import pandas as pd
8 #直接读到pandas的数据框中
9 pd.DataFrame(data=data.data, columns=data.feature_names)
下面是第3行和第4行的输出:
['DESCR', 'data', 'feature_names', 'target', 'target_names']

Iris Plants Database
====================

Notes
-----
Data Set Characteristics:
    :Number of Instances: 150 (50 in each of three classes)
    :Number of Attributes: 4 numeric, predictive attributes and the class
    :Attribute Information:
        - sepal length in cm
        - sepal width in cm
        - petal length in cm
        - petal width in cm
        - class:
                - Iris-Setosa
                - Iris-Versicolour
                - Iris-Virginica
    :Summary Statistics:

    ============== ==== ==== ======= ===== ====================
                    Min  Max   Mean    SD   Class Correlation
    ============== ==== ==== ======= ===== ====================
    sepal length:   4.3  7.9   5.84   0.83    0.7826
    sepal width:    2.0  4.4   3.05   0.43   -0.4194
    petal length:   1.0  6.9   3.76   1.76    0.9490  (high!)
    petal width:    0.1  2.5   1.20  0.76     0.9565  (high!)
    ============== ==== ==== ======= ===== ====================

    :Missing Attribute Values: None
    :Class Distribution: 33.3% for each of 3 classes.
    :Creator: R.A. Fisher
    :Donor: Michael Marshall (MARSHALL%PLU@io.arc.nasa.gov)
    :Date: July, 1988

This is a copy of UCI ML iris datasets.
http://archive.ics.uci.edu/ml/datasets/Iris

The famous Iris database, first used by Sir R.A Fisher

This is perhaps the best known database to be found in the
pattern recognition literature.  Fisher's paper is a classic in the field and
is referenced frequently to this day.  (See Duda & Hart, for example.)  The
data set contains 3 classes of 50 instances each, where each class refers to a
type of iris plant.  One class is linearly separable from the other 2; the
latter are NOT linearly separable from each other.

References
----------
...
数据的可视化展示
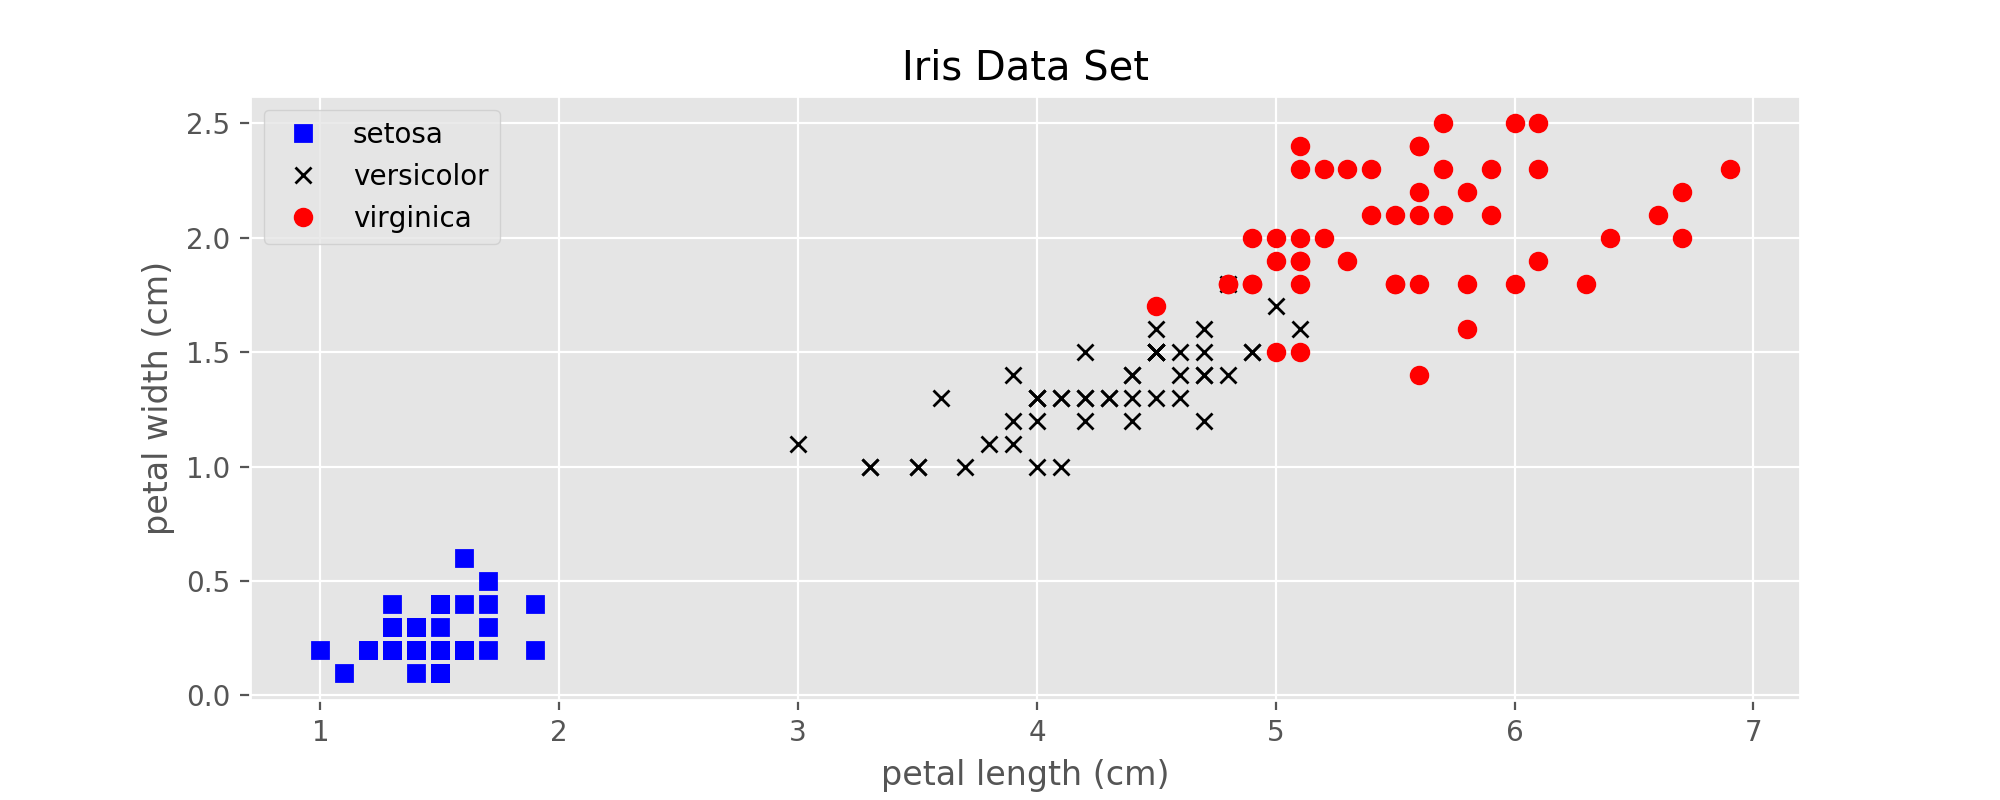
将数据用图像的形式展示出来,可以对该数据集有一个直观的整体印象。下面利用该数据集4个特征中的后两个,即花瓣的长度和宽度,来展示所有的样本点。
 1 import matplotlib.pyplot as plt
 2 plt.style.use('ggplot')
 3
 4
 5 X = data.data  # 只包括样本的特征,150x4
 6 y = data.target  # 样本的类型,[0, 1, 2]
 7 features = data.feature_names  # 4个特征的名称
 8 targets = data.target_names  # 3类鸢尾花的名称,跟y中的3个数字对应
 9
10 plt.figure(figsize=(10, 4))
11 plt.plot(X[:, 2][y==0], X[:, 3][y==0], 'bs', label=targets[0])
12 plt.plot(X[:, 2][y==1], X[:, 3][y==1], 'kx', label=targets[1])
13 plt.plot(X[:, 2][y==2], X[:, 3][y==2], 'ro', label=targets[2])
14 plt.xlabel(features[2])
15 plt.ylabel(features[3])
16 plt.title('Iris Data Set')
17 plt.legend()
18 plt.savefig('Iris Data Set.png', dpi=200)
19 plt.show()
利用上面的代码画出来的图如下:
Reference
https://en.wikipedia.org/wiki/Iris_flower_data_set
https://archive.ics.uci.edu/ml/datasets/Iris/
https://matplotlib.org/users/style_sheets.html
http://scikit-learn.org/stable/datasets/index.html
今天的文章Iris数据集分享到此就结束了,感谢您的阅读,如果确实帮到您,您可以动动手指转发给其他人。
版权声明:本文内容由互联网用户自发贡献,该文观点仅代表作者本人。本站仅提供信息存储空间服务,不拥有所有权,不承担相关法律责任。如发现本站有涉嫌侵权/违法违规的内容, 请发送邮件至 举报,一经查实,本站将立刻删除。
如需转载请保留出处:https://bianchenghao.cn/46291.html


