一、背景
提起相关系数,我们最常见的是“Pearson”,“Spearman”等相关系数。但是,我们有时候常常忽略“偏”相关系数。其实,最近在做医学相关的项目时候,遇到这样的问题。
比如,在需求糖尿病患者中,异常代谢无与病人发病时间的关联时,由于糖尿病受到各种其他临床因素的影响,这时在进行相关性分析时,不得不考虑“混杂”因素的影响。
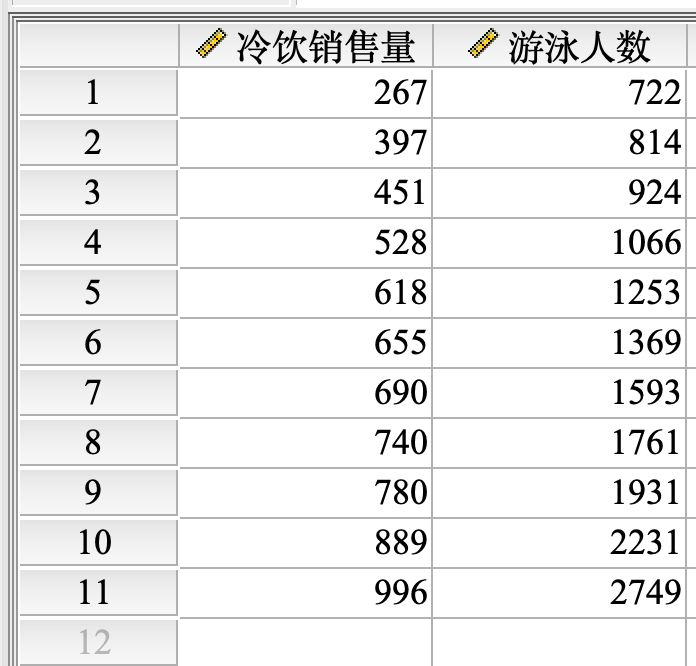
这里,我们举一个更简单的示例:游泳可以促进冷饮的销售,即游泳的人越多,冷饮的销售量也越多。
统计数据如下:
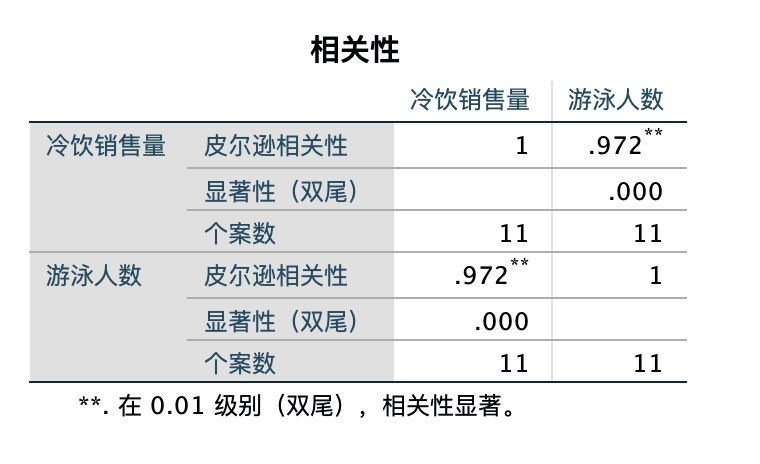
第一种:Pearson检测
结果如下:
如上表,”冷饮销售量“和”游泳人数“两个变量的简单相关分析,结果显示Pearson相关系数为”0.972“,P值小于0.01,相关关系具有统计学意义。
但事实上真是如此吗?
第二种:偏相关性检验
为什么要用偏相关呢?
因为u冷饮销售量增加和游泳人数地增加都可能与“天气热”相联系,所以,很有可能是因为天气热导致吃冷饮的人和游泳的人同时增加。
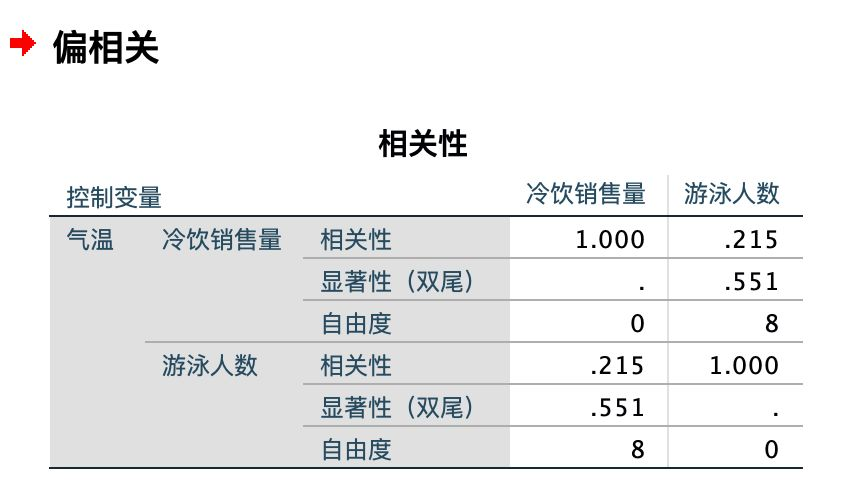
基于此,我们再纳入一个变量——“气温”,把气温作为控制变量,然后再进行“冷饮销售量”和“游泳人数”的相关分析。
如上图偏相关分析的结果,纳入“气温”这个控制变量后,“冷饮销售量”和“游泳人数”的相关系数低至0.215,而且P值大于0.05,相关关系不再具有统计学意义。因此,我们就有充分的理由怀疑上文两变量的直接相关系数是不准确的。
二、偏相关的原理
题设:
- 统计 x 1 x_1 x1和 x 2 x_2 x2之间的相关性,其存在混杂(协变量)因素 z 1 , z 2 , . . . , z k z_1, z_2, …, z_k z1,z2,...,zk (可以多个)
计算:“先回归,求残差,再相关”
- 以 x 1 x_1 x1和 x 2 x_2 x2为因变量,以 z 1 , z 2 , . . . , z k z_1, z_2, …, z_k z1,z2,...,zk 为自变量,进行多重线性回归,获得 x 1 x_1 x1和 x 2 x_2 x2 的预测值: x 1 ^ \widehat{x_1} x1
和 x 2 ^ \widehat{x_2} x2
- 计算残差值: e 1 ^ = x 1 − x 1 ^ \widehat{e_1}=x_1-\widehat{x_1} e1
=x1−x1
e 2 ^ = x 2 − x 2 ^ \widehat{e_2}=x_2-\widehat{x_2} e2
=x2−x2
- 计算偏相关系数: p c o r = c o r r ( e 1 ^ , e 2 ^ ) pcor=corr(\widehat{e_1}, \widehat{e_2}) pcor=corr(e1
,e2
)
三、R语言实战
# partial_Spearman: Partial Spearman's Rank Correlation
# Description
partial.Spearman computes the partial Spearman\'s rank correlation between variable X and variable Y adjusting for other variables, Z. The basic approach involves fitting a specified model of X on Z, a specified model of Y on Z, obtaining the probability-scale residuals from both models, and then calculating their Pearson\'s correlation. X and Y can be any orderable variables, including continuous or discrete variables. By default, partial.Spearman uses cumulative probability models (also referred as cumulative link models in literature) for both X on Z and Y on Z to preserve the rank-based nature of Spearman\'s correlation, since the model fit of cumulative probability models only depends on the order information of variables. However, for some specific types of variables, options of fitting parametric models are also available. See details in fit.x and fit.y

# Usage
partial.Spearman(formula, data, fit.x = "orm", fit.y = "orm",
  link.x = c("logit", "probit", "cloglog", "loglog", "cauchit", "logistic"),
  link.y = c("logit", "probit", "cloglog", "loglog", "cauchit", "logistic"),
  subset, na.action = getOption("na.action"), fisher = TRUE,
  conf.int = 0.95)

# Details
To compute the partial Spearman's rank correlation between X and Y adjusting for Z, formula is specified as X | Y ~ Z. This indicates that models of X ~ Z and Y ~ Z will be fit.
For Examples:
# NOT RUN {

data(PResidData)
#### fitting cumulative probability models for both Y and W
partial.Spearman(c|w ~ z,data=PResidData)
#### fitting a cumulative probability model for W and a poisson model for c
partial.Spearman(c|w~z, fit.x="poisson",data=PResidData)
partial.Spearman(c|w~z, fit.x="poisson", fit.y="lm.emp", data=PResidData )
# }
今天的文章r语言偏相关分析_r语言相关系数「建议收藏」分享到此就结束了,感谢您的阅读。
版权声明:本文内容由互联网用户自发贡献,该文观点仅代表作者本人。本站仅提供信息存储空间服务,不拥有所有权,不承担相关法律责任。如发现本站有涉嫌侵权/违法违规的内容, 请发送邮件至 举报,一经查实,本站将立刻删除。
如需转载请保留出处:http://bianchenghao.cn/85262.html


