基于Isotonic回归的鸢尾花数据集回归问题
1. 作者介绍
刘静,女,西安工程大学电子信息学院,2021级硕士研究生
研究方向:机器视觉与人工智能
电子邮件:2350588223@qq.com
孟莉苹,女,西安工程大学电子信息学院,2021级硕士研究生,张宏伟人工智能课题组
研究方向:机器视觉与人工智能
电子邮件:2425613875@qq.com
2.保序回归算法
2.1 算法原理
保序回归是回归算法的一种。保序回归给定一个有限的实数集合 Y=y1,y2,……yn代表观察到的响应,以及X=x1,x2,……xn代表未知的响应值,训练一个模型来最小化下列方程:
其中x1≤x2≤⋯≤xn ,wi为权重是正值。其结果方程称为保序回归,而且其解是唯一的。它可以被视为有顺序约束下的最小二乘法问题。实际上保序回归在拟合原始数据点时是一个单调函数。我们实现池旁者算法,它使用并行保序回归。训练数据是DataFrame格式,包含标签、特征值以及权重三列。另外保序算法还有一个参数名为isotonic,其默认值为真,它指定保序回归为保序(单调递增)或者反序(单调递减)。
2.2 保序回归算法举例
问题描述:给定一个无序数字序列,要求不改变每个元素的位置,但可以修改每个元素的值,修改后得到一个非递减序列,问如何使误差(该处取平方差)最小?
保序回归法:从该序列的首元素往后观察,一旦出现乱序现象停止该轮观察,从该乱序元素开始逐个吸收元素组成一个序列,直到该序列所有元素的平均值小于或等于下一个待吸收的元素。
举例:
原始序列:<9, 10, 14>
结果序列:<9, 10, 14>
分析:从9往后观察,到最后的元素14都未发现乱序情况,不用处理。
原始序列:<9, 14, 10>
结果序列:<9, 12, 12>
分析:从9往后观察,观察到14时发生乱序(14>10),停止该轮观察转入吸收元素处理,吸收元素10后子序列为<14, 10>,取该序列所有元素的平均值得12,故用序列<12, 12>替代<14, 10>。吸收10后已经到了最后的元素,处理操作完成。
原始序列:<14, 9, 10, 15>
结果序列:<11, 11, 11, 15>
分析:从14往后观察,观察到9时发生乱序(14>9),停止该轮观察转入吸收元素处理,吸收元素9后子序列为<14, 9>。求该序列所有元素的平均值得12.5,由于12.5大于下个带吸收的元素10,所以再吸收10,得序列<14, 9, 10>。求该序列所有元素的平均值得11,由于11小于下个带吸收的元素15,所以停止吸收操作,用序列<11, 11, 11>替代<14, 9, 10>。
3. 鸢尾花数据集介绍
包含 3 类分别为山鸢尾(Iris-setosa)、变色鸢尾(Iris-versicolor)和维吉尼亚鸢尾(Iris-virginica),共 150 条数据,每类各 50 个数据,每条记录都有 4 项特征:花萼长度、花萼宽度、花瓣长度、花瓣宽度,通常可以通过这4个特征预测鸢尾花卉属于哪一品种。
3.1 数据集获取
首先要在自己的Python环境中下载sklearn(进入个人虚拟环境并输入):
pip install scikit-learn
接着就可以输入下面代码,下载数据集:
from sklearn.decomposition import PCA
from sklearn.datasets import load_iris
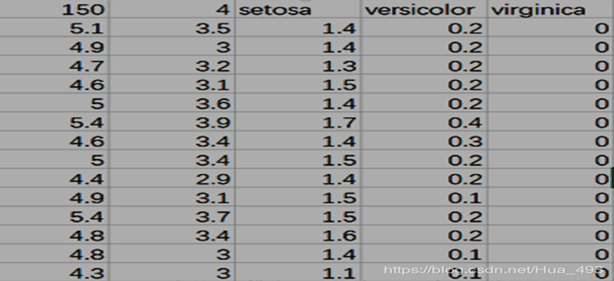
Iris数据集包含在sklearn库当中,具体在sklearn\datasets\data文件夹下,文件名为iris.csv。其数据格式如下:
4.代码实现
4.1 导入需要的包
import matplotlib.pyplot as plt
from sklearn.decomposition import PCA
from sklearn.datasets import load_iris
import numpy as np
import matplotlib.pyplot as plt
from matplotlib.collections import LineCollection
from sklearn.linear_model import LinearRegression
from sklearn.isotonic import IsotonicRegression
import pandas as pd
from sklearn.utils import check_random_state
4.2 下载鸢尾花数据集并输出每个样本特征属性
#然后以字典的形式加载鸢尾花数据集,使用y表示数据集中的标签,使用x表示数据集中的属性数据。
data = load_iris()
y = data.target
x = data.data
np.random.seed(5)
centers = [[1, 1], [-1, -1], [1, -1]]             #鸢尾花数据集输出每个样本的特征属性值
tt = pd.DataFrame(data=data.data, columns=data.feature_names) #将数据集数据转换成panda
tt['species'] = data.target  #把鸢尾花类型加入到数据集中
data = tt
data.rename(columns={
   'sepal length (cm)':"萼片长",
                     "sepal width (cm)":"萼片宽",
                     "petal length (cm)":"花瓣长",
                     "petal width (cm)":"花瓣宽",
                     "species":"种类"},inplace=True)
kind_dict = {

    0:"Setosa",
    1:"Versicolour",
    2:"Virginica"
}
data["种类"] = data["种类"].map(kind_dict)
data.head()
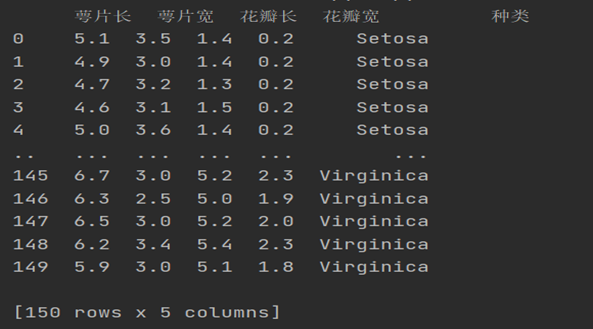
print(data.head(150))
4.3 利用PCA降维并调用保序回归
#调用PCA算法进行降维主成分分析
#指定主成分个数,即降维后数据维度,降维后的数据保存在reduced_x中。
pca = PCA(n_components=1)
reduced_x = pca.fit_transform(x)
x = reduced_x.flatten()

#Fit IsotonicRegression and LinearRegression models
ir = IsotonicRegression()
y_ = ir.fit_transform(x, y)
lr = LinearRegression()
lr.fit(x[:, np.newaxis], y)  # x needs to be 2d for LinearRegression
#Plot result
segments = [[[i, y[i]], [i, y_[i]]] for i in range(150)]
lc = LineCollection(segments, zorder=0)
lc.set_array(np.ones(len(y)))
lc.set_linewidths(np.full(150, 0.5))
fig, (ax0, ax1) = plt.subplots(ncols=2, figsize=(10, 6))
ax0.plot(x, y, 'r.', markersize=12)
ax0.plot(x, y_, 'b.-', markersize=12)
ax0.plot(x, lr.predict(x[:, np.newaxis]), 'c-')
ax0.add_collection(lc)
ax0.legend(('Data','Isotonic Fit','Linear fit'), loc='lower right')
ax0.set_title('Isotonic regression')

x_test=np.linspace(-10,100,1000)
ax1.plot(x_test,ir.predict(x_test),'b-')
ax1.plot(ir.X_thresholds_, ir.y_thresholds_, 'b.', markersize=12)
ax1.set_title("Prediction function (%d thresholds)" % len(ir.X_thresholds_))
plt.show()
correct = 0
for i in range(150):
    if y_[i] < 2 and y_[i] > 1:
        y[i] = 3
    if y[i] == int(y_[i]):
        correct = correct+1
print(correct/150*100,"%")
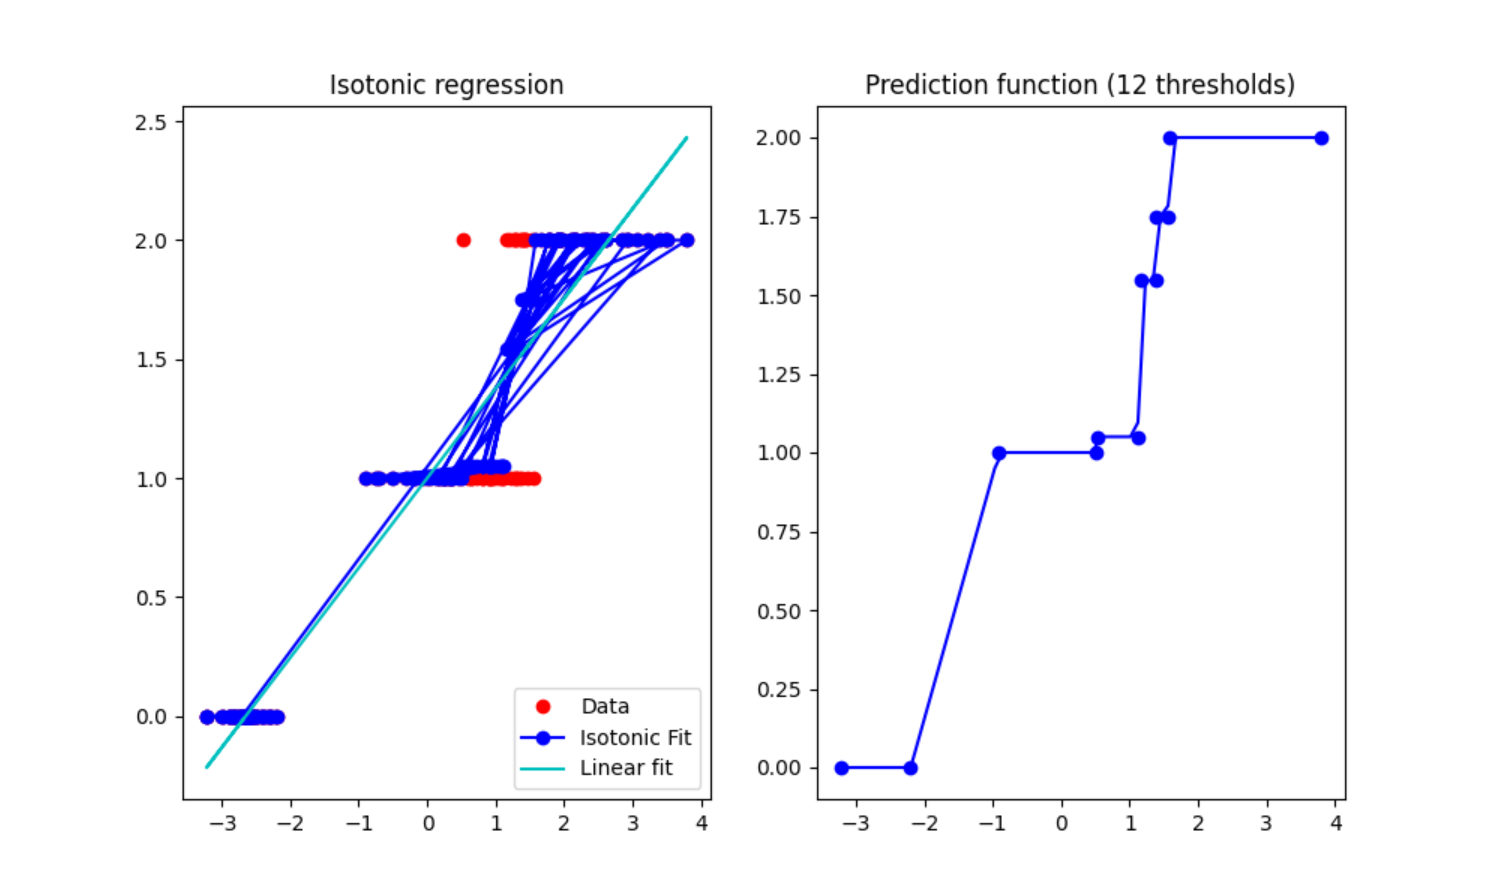
4.4 实验结果
4.5 完整代码
#导入鸢尾花数据集,调用matplotlib包用于数据的可视化,并加载PCA算法包。
import matplotlib.pyplot as plt
from sklearn.decomposition import PCA
from sklearn.datasets import load_iris

import numpy as np
import matplotlib.pyplot as plt
from matplotlib.collections import LineCollection
from sklearn.linear_model import LinearRegression
from sklearn.isotonic import IsotonicRegression
import pandas as pd
from sklearn.utils import check_random_state

#然后以字典的形式加载鸢尾花数据集,使用y表示数据集中的标签,使用x表示数据集中的属性数据。
data = load_iris()
y = data.target
x = data.data
np.random.seed(5)
centers = [[1, 1], [-1, -1], [1, -1]]             #鸢尾花数据集输出每个样本的特征属性值
tt = pd.DataFrame(data=data.data, columns=data.feature_names) #将数据集数据转换成panda
tt['species'] = data.target  #把鸢尾花类型加入到数据集中
data = tt
data.rename(columns={
   'sepal length (cm)':"萼片长",
                     "sepal width (cm)":"萼片宽",
                     "petal length (cm)":"花瓣长",
                     "petal width (cm)":"花瓣宽",
                     "species":"种类"},inplace=True)
kind_dict = {

    0:"Setosa",
    1:"Versicolour",
    2:"Virginica"
}
data["种类"] = data["种类"].map(kind_dict)
data.head()
print(data.head(150))

#调用PCA算法进行降维主成分分析
#指定主成分个数,即降维后数据维度,降维后的数据保存在reduced_x中。
pca = PCA(n_components=1)
reduced_x = pca.fit_transform(x)
x = reduced_x.flatten()

#Fit IsotonicRegression and LinearRegression models
ir = IsotonicRegression()
y_ = ir.fit_transform(x, y)
lr = LinearRegression()
lr.fit(x[:, np.newaxis], y)  # x needs to be 2d for LinearRegression
#Plot result
segments = [[[i, y[i]], [i, y_[i]]] for i in range(150)]
lc = LineCollection(segments, zorder=0)
lc.set_array(np.ones(len(y)))
lc.set_linewidths(np.full(150, 0.5))
fig, (ax0, ax1) = plt.subplots(ncols=2, figsize=(10, 6))
ax0.plot(x, y, 'r.', markersize=12)
ax0.plot(x, y_, 'b.-', markersize=12)
ax0.plot(x, lr.predict(x[:, np.newaxis]), 'c-')
ax0.add_collection(lc)
ax0.legend(('Data','Isotonic Fit','Linear fit'), loc='lower right')
ax0.set_title('Isotonic regression')

x_test=np.linspace(-10,100,1000)
ax1.plot(x_test,ir.predict(x_test),'b-')
ax1.plot(ir.X_thresholds_, ir.y_thresholds_, 'b.', markersize=12)
ax1.set_title("Prediction function (%d thresholds)" % len(ir.X_thresholds_))
plt.show()
correct = 0
for i in range(150):
    if y_[i] < 2 and y_[i] > 1:
        y[i] = 3
    if y[i] == int(y_[i]):
        correct = correct+1
print(correct/150*100,"%")
今天的文章鸢尾花回归模型_先序遍历的递归算法「建议收藏」分享到此就结束了,感谢您的阅读。
版权声明:本文内容由互联网用户自发贡献,该文观点仅代表作者本人。本站仅提供信息存储空间服务,不拥有所有权,不承担相关法律责任。如发现本站有涉嫌侵权/违法违规的内容, 请发送邮件至 举报,一经查实,本站将立刻删除。
如需转载请保留出处:https://bianchenghao.cn/87643.html


