学不止,更不止。小伙伴们一起加油啊!
- 课程列表
Lesson 1 Essential
Lesson 2 Acessing data
Lesson 3 Exloring and Validating data
Lesson 4 Preparing data
Lesson 5 Analyzing and Reporting on Data
Lesson 6 Exporting Results
Lesson 7 Using SQL in SAS - 视频
操作平台:SAS Studio
Lesson 2 Acessing data:
一、导入structured data
1. Use a library to read SAS file
注:如何新建一个空library?
libname libref "path" #使用libname语句,其中libref是指新建的library的名字。
开始正题:
libname libref base "path";#从某路径中读入SAS格式(因为engine=base)的数据,放在名为libref的library中

proc contents data=libref.table_name;#proc contents命令查看该library中SAS table的table properties
run;

libname libref clear;#清除libref这个library,单里面的数据仍然保留,再运行libname libref "path"时该library还会出现.
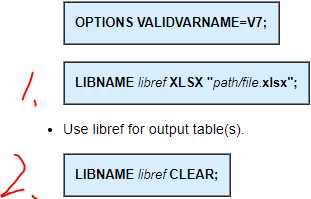
1. Use a library to read EXCEL file
options validvarname=V7;#保证excel数据的列名中的空格在读取后变成'_'

libname libref XLSX "path/file_name";#这个excel file里包含table1/2/3...,相当于每个excel文件中包含很多sheets. 这里区别与读取SAS文件时的路径,excel要多一步定位到excel file. SAS只需定位到file所在路径,因为一个table就是一个file.

proc contents data=libref.table1_name;#相当于查看table properities
run;

libname libref clear; #删除library之后,数据仍然保留,rerun一遍libname语句,library和数据表都会出现。
注意:sas file的engine是base, excel file的engine是xlsx.
读取的路径,Excel是file里包含着若干个table,因此读取的路径要具体到table的上一级,即“path/file_name”. SAS file直接是一个数据表,因此table的上一级就是“path”.
二、导入unstructured data
1.
(1)generally导入data: 注意replace和guessingrow的用法
- replace保证当导入的file有变动,想重新导入的时候,可以overwrite上次的file.
- 什么是gussingrows:
By default, GuessingRows is 20, which means SAS uses the first 20 rows of the Excel spreadsheet to determine whether the data within a column is character or numeric, and what its length should be. 如果默认为20,根据前20行确定每个column的内容长度为8,则会导致20行之后名字超过8个字符的部分显示不出来。 一般如果table为2784行,为了保证每一列的内容都能显示完全,可以设置guessingrows=3000.
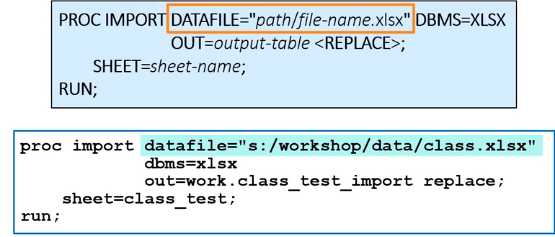
(2) 导入excel data: 增加sheet命令,指定导入excel file中的哪一个sheet
# 1. 导入一个tab文档
proc import datafile="FILEPATH/storm_damage.tab"#注意这里没有分号,replace后面才有分号。
            dbms=tab
            out=storm_damage_tab
            replace;
run;
#2. 导入一个excel文档:如上截图所示
#3. 导入一个csv文档
proc import datafile="/home/u46405665/EPG194/data/np_traffic.csv"
	dbms=csv
	out=traffic
	replace;
	guessingrows=max;
run;
#4. 导入dat文件
proc import datafile="/home/u46405665/EPG194/data/np_traffic.dat"
            dbms=dlm
            out=traffic2
            replace;
    guessingrows=3000; #因为数据一共2784行
    delimiter="|";
run;
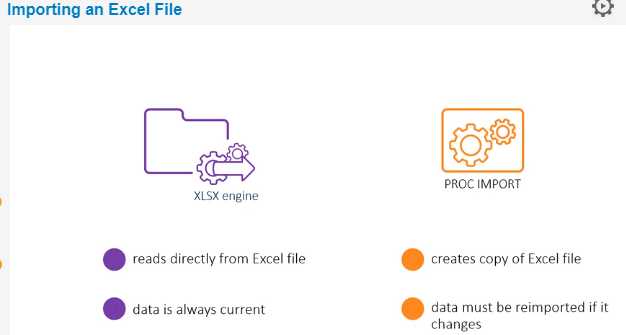
注:1. 用Library和proc import这两个方法导入excel数据有什么区别呢?
2. 文本的缺失值为空格,数值的缺失值为点
Lesson 3 Exploring and Validating data
一、Format
format variable1 format_name;
data=freq;
    tables StartDate;
    format startdate monname.;#把startdata这个变量变成monname.这个format;
    format cost comma6.;#把cost这个变量变成comma6.这个格式;
run;
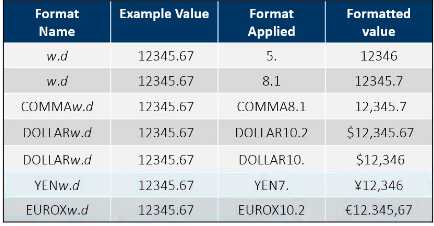
- Common Formats for Numeric Values
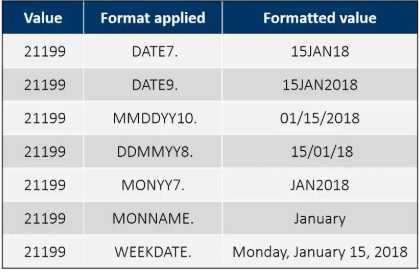
- Common Formats for Date Values
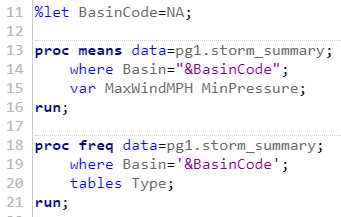
二、 Filtering Rows with Macro Variables
%LET macro-variable=value;
- Example WHERE Statements with Macro Variables:
WHERE numvar=¯ovar;
WHERE charvar="¯ovar";
WHERE datevar="¯ovar"d
eg. : 这里Basinconde就是macro-variable, 改变NA即可直接改变所有basincode代指, 非常便捷。
注:"¯ovar"必须用双引号,不能用单引号。
Lesson 4 Preparing data
一、创建新变量
所有常见的function见Lesson 4 Preparing data
- character functions:
| upcase(char1) lowcase(char1) | 全部大/小写 |
|---|---|
| propcase(char1) | 所有单词仅首字母大写,其他字母小写。propcase(apple pear), Apple Pear |
| cats(char1,char2) | 连接两个单词,cats(app, le), apple |
| substr(char, position, length) | 从某个字段的某一位开始截取几个字符,substr(apple, 2, 3), ppl |
- Date functions that create SAS date values
| MDY(month, day, year) | 返回日期形式,把输入的品日来,MDY(JAN, 1, 2015),得到JAN/1/2015 |
|---|---|
| YRDIF(startdate, enddate,“AGE”) | 算开始时间和结束时间之间的间隔天数,age是默认参数。 |
#设置列字段的format
data eu_occ2016;
    set pg1.eu_occ;
    where YearMon like "2016%"; #这里日期不用写成'2016%'d
    format Hotel ShortStay Camp comma17.;#Hotel ShortStay Camp全都是comma17.的format,不用每个变量后面都写一次comma17.,例如format Hotel COMMA17. ShortStay COMMA17. Camp COMMA17.;
    drop geo;
run;
#新增列变量,并设置列变量format.
data eu_occ_total;#输出名为eu_cc_total的数据表
    set pg1.eu_occ;# 输入pg1这个library里的eu_occ数据表
    \*新增year,month, reportdate, total这4个新的列变量*\
    Year=substr(YearMon,1,4); #新建year这个变量列,从yearmon这个变量的第一个字节开始截取四个字节并返回值
    Month=substr(YearMon,6,2);
    ReportDate=MDY(Month,1,Year);
    Total=sum(Hotel,ShortStay,Camp);
    format Hotel ShortStay Camp Total comma17.
           ReportDate monyy7.;#Hotel ShortStay Camp Total都设置成comma17.的format
    keep Country Hotel ShortStay Camp ReportDate Total;#新增的变量必须放在keep后才能output出来,否则结果没有新增的这些列变量。
run;
二、循环和条件控制
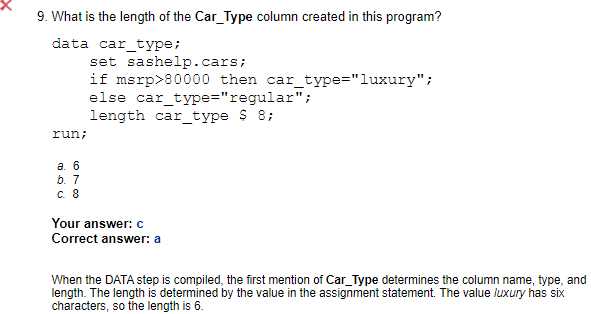
length variable $ <length>控制变量的长度,length basin $ 10表示basin为10个字节的变量。
data storm_summary2;
	set pg1.storm_summary;
	keep Basin Season Name MaxWindMPH Ocean;
	Basin=upcase(Basin);
	OceanCode=substr(Basin,2,1);
	length Ocean $ 10; #这里length不能放在run前else后,起不到规定ocear长度的作用
	if OceanCode="I" then Ocean="Indian";#上面如果不规定ocean的长度,这里就会因为india的长度默认ocean长度为6,导致后面的atlantic和pacific被截断,变成atlant和pacifi.
	else if OceanCode="A" then Ocean="Atlantic";#这里的“A”时大小写敏感的,例如对于na,则会返回pacific,而不是atlantic.为了避免这种情况可以先把basin全变成大写
	else Ocean="Pacific";
run;
注:(1).length语句的位置必须在if 语句之前,否则会以第一个条件输出结果的字符串长度决定变量长度。这里,因为length语句的位置不对,而且luxury是6个字符。
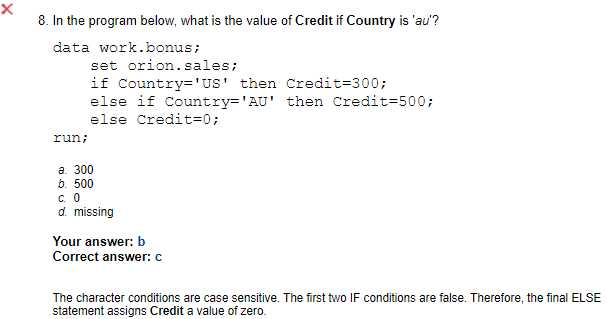
(2). filtering语句对大小写敏感。“AU”不同于“au”
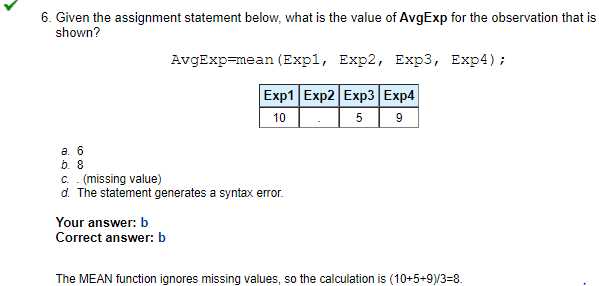
(3) mean()会忽略缺失值来计算。
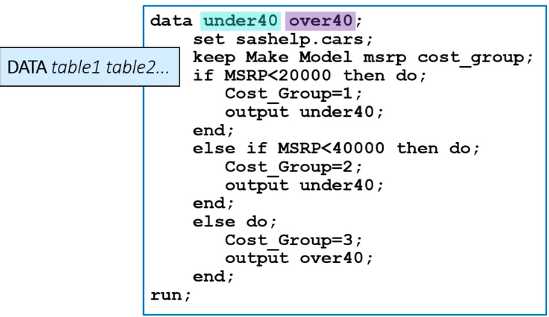
- if-then后面只能跟1个执行语句,不能用and跟多个执行语句。因此有了if-then do end语句,可以执行多个语句。见Lesson 4 Preparing data
- data可以同时输出两个table.
Lesson 5 Analyzing and Reporting on Data
-
Enhancing Reports with Titles, Footnotes, and Labels
-
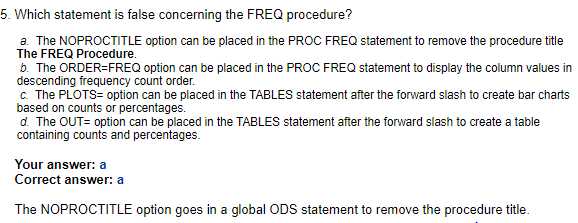
Creating Frequency Reports(关于
proc freq的</ options>
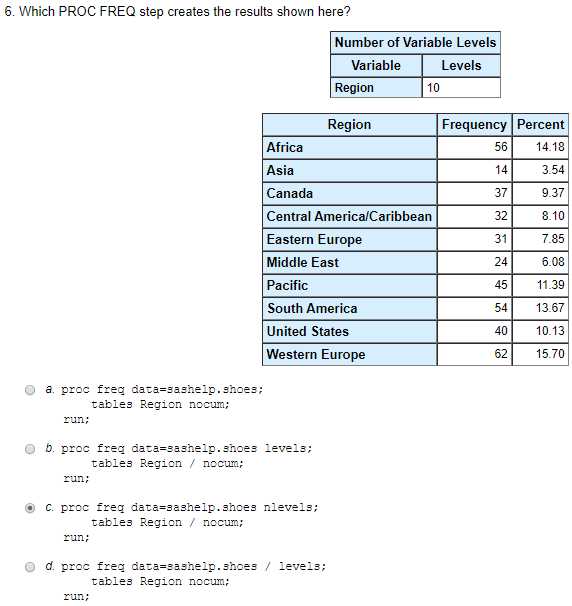
,好多options, 没太搞懂,再多看几次视频,做一做practice和activity。)proc freqstatements后面跟的:order=freq让累计频率表倒序显示;nlevels计算变量行数tables后面的:
| </ options> | 含义 |
|---|---|
/nocum |
频率统计表不要累计频数和累计频率 |
/ nocol ; / norow |
不要列统计,不要行统计 |
plots=freqplot |
画出频率统计图 |
out |
输出表格 |
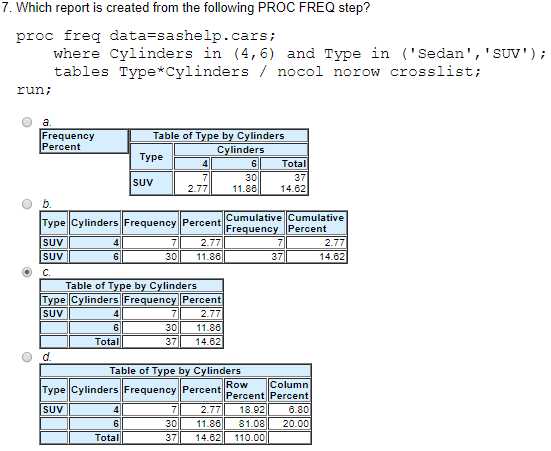
crosslist |
交叉分析,type为一级标题,cylinder为二级标题 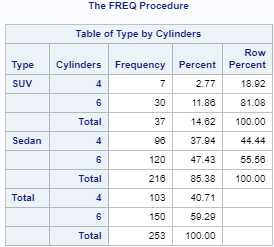 |
/ nopersent |
频率统计表不要频率占比统计 |
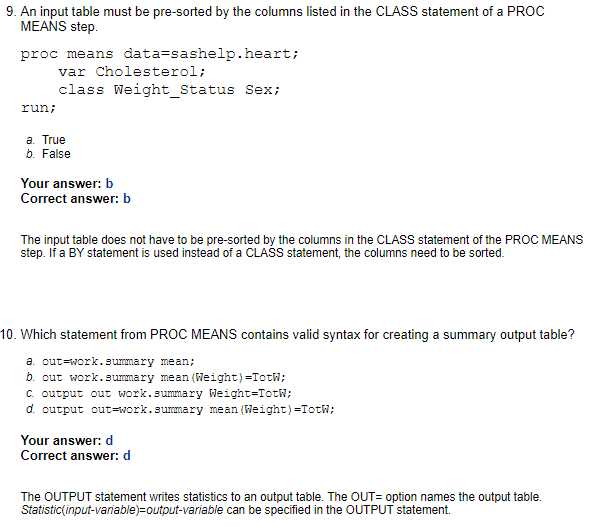
- Creating Summary Statistics Reports(关于
proc means的</ options>,好多options, 没太搞懂,再多看几次视频,做一做practice和activity)proc means后的:
| </ options> | 含义 |
|---|---|
CLASS col-name(s) |
类似于group by,类似于crosslist 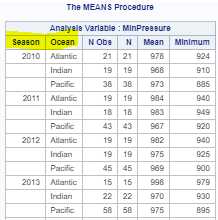 |
ways n |
 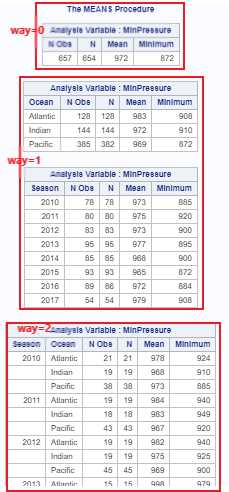 |
OUTPUT OUT=output-table <statistic(col-name)=col-name> < / option(s) |
生成report table |
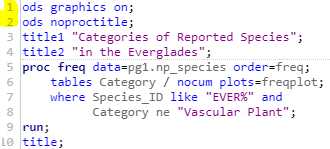
- ODS: 放在proc命令前面的
ods graphics on: 允许画图
ods noproctitle: 不要proc语句自动带的title
一、Enhancing Reports with Titles, Footnotes, and Labels
- title
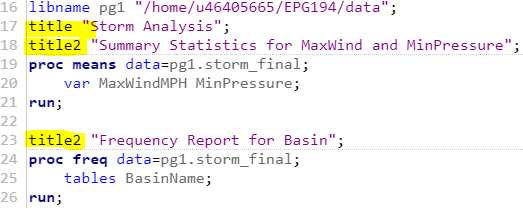
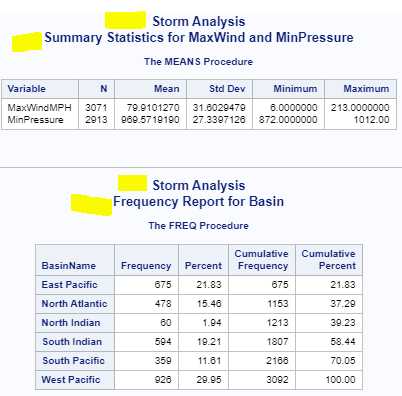
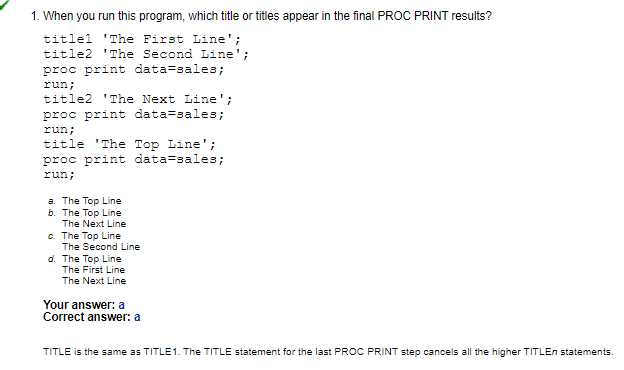
title<n>如何应用,title和<n>之间不用加空格。<n>表示几级标题。
例子:title表示一级标题,返回的两个表格应用了title, title2表示二级标题,两个title2分别位于两个表上。
- label
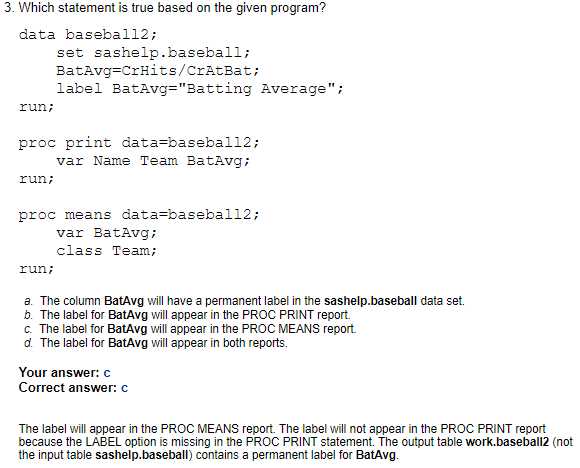
- lable的作用相当与更改列变量的名字,方面对外reporting的时候便于理解(一般变量都是简写,例如
label AvgMPG="Average Miles per Gallon"等号左边是旧变量名,右边是新变量名)。但对内并没有实际改变列变量名。 - 给多个变量加label:只在最后一个语句后面加分号,换行不用加分号。
- 所有step都会自动把label放在结果中,只有
proc print命令需要在第一行重新写一下label,结果才会出现label. 例如proc means后面不用加label,但是proc print需要加。
注:几道错题:
Lesson 6 Exporting Results
一、Exporting data
- 法一:
prox export,注意可以用macro variable来代指导出。这里storm_final.csv文件将会被导出到EPG194下面的output文件夹中。
- 法二:
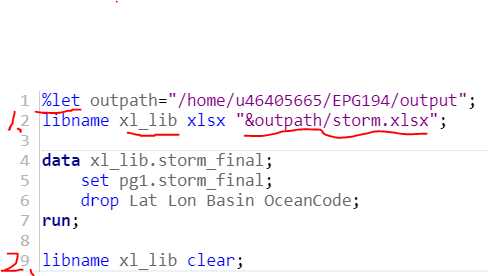
libname,分两步,第一步:先建立library用于暂时存放导入的数据,并指定未来存放的位置,即'path/file.xlsx',第二步:清除这个暂时的library. 然后我们在指定路径里就可以看到保存的excel表,并且可以直接下载下来。
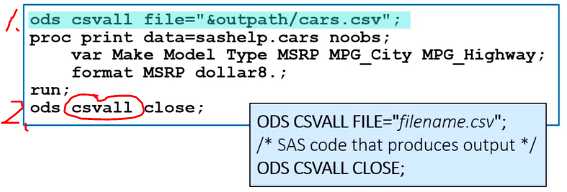
二、Exporting reports - 导出csv
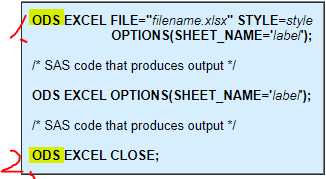
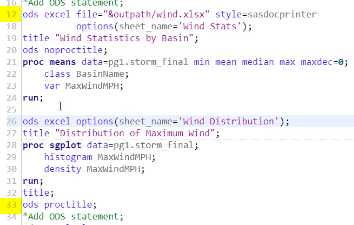
- 导出excel: 三明治,两个ODS夹一块语句。
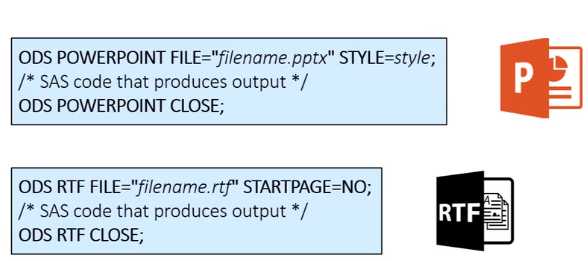
- 导出RTF(即word文档) 见视频lesson 6–Exporting Results to PowerPoint and Microsoft Word
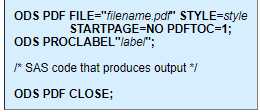
- 导出PDF 见视频lesson 6–Exporting Results to PDF
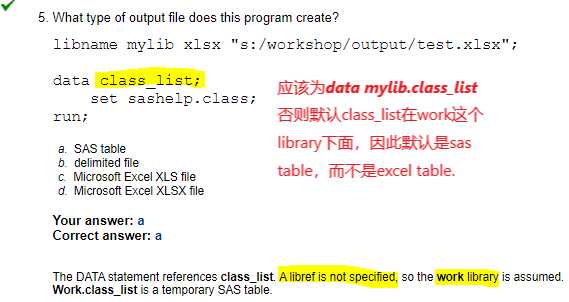
注:几道错题:
Lesson 7 Using SQL in SAS
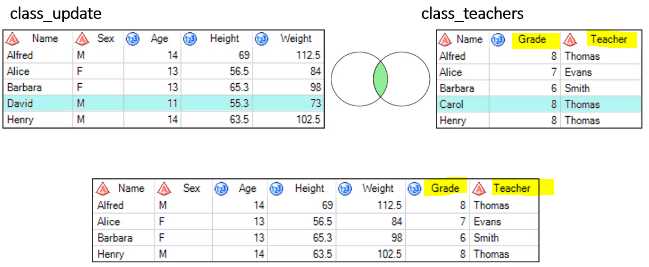
- inner/outer/left/right join
今天的文章SAS语法分享到此就结束了,感谢您的阅读,如果确实帮到您,您可以动动手指转发给其他人。
版权声明:本文内容由互联网用户自发贡献,该文观点仅代表作者本人。本站仅提供信息存储空间服务,不拥有所有权,不承担相关法律责任。如发现本站有涉嫌侵权/违法违规的内容, 请发送邮件至 举报,一经查实,本站将立刻删除。
如需转载请保留出处:https://bianchenghao.cn/27901.html


