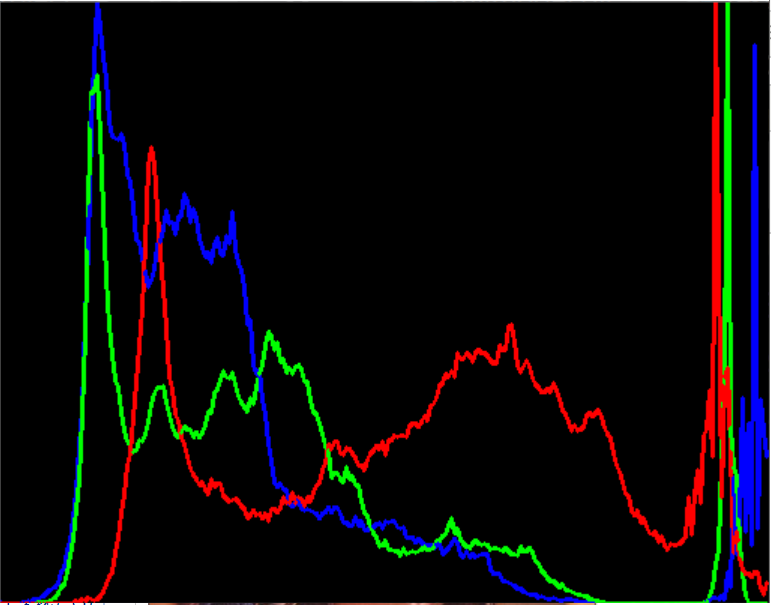
直方图是对图像像素的统计分布,它统计了每个像素(0到L-1)的数量。
直方图均衡化就是将原始的直方图拉伸,使之均匀分布在全部灰度范围内,从而增强图像的对比度。
直方图均衡化的中心思想是把原始图像的的灰度直方图从比较集中的某个区域变成在全部灰度范围内的均匀分布。
cv2.calcHist(images, channels, mask, histSize, ranges[, hist[, accumulate ]]) ->hist
参数说明:
一、images(输入图像)参数必须用方括号括起来。
二、计算直方图的通道。
三、Mask(掩膜),一般用None,表示处理整幅图像。
四、histSize,表示这个直方图分成多少份(即多少个直方柱)。
五、range,直方图中各个像素的值,[0.0, 256.0]表示直方图能表示像素值从0.0到256的像素。
六、最后是两个可选参数,由于直方图作为函数结果返回了,所以第六个hist就没有意义了(待确定) 最后一个accumulate是一个布尔值,用来表示直方图是否叠加。
示例
from __future__ import print_function
from __future__ import division
import cv2 as cv
import numpy as np
import argparse

## [Load image]
src = cv.imread('D:/lena.jpg')
if src is None:
    print('Could not open or find the image:', args.input)
    exit(0)
## [Load image]

## [Separate the image in 3 places ( B, G and R )]
bgr_planes = cv.split(src)
## [Separate the image in 3 places ( B, G and R )]

## [Establish the number of bins]
histSize = 256
## [Establish the number of bins]

## [Set the ranges ( for B,G,R) )]
histRange = (0, 256) # the upper boundary is exclusive
## [Set the ranges ( for B,G,R) )]

## [Set histogram param]
accumulate = False
## [Set histogram param]

## [Compute the histograms]
b_hist = cv.calcHist(bgr_planes, [0], None, [histSize], histRange, accumulate=accumulate)
g_hist = cv.calcHist(bgr_planes, [1], None, [histSize], histRange, accumulate=accumulate)
r_hist = cv.calcHist(bgr_planes, [2], None, [histSize], histRange, accumulate=accumulate)
## [Compute the histograms]

## [Draw the histograms for B, G and R]
hist_w = 512
hist_h = 400
bin_w = int(round( hist_w/histSize ))

histImage = np.zeros((hist_h, hist_w, 3), dtype=np.uint8)
## [Draw the histograms for B, G and R]

## [Normalize the result to ( 0, histImage.rows )]
cv.normalize(b_hist, b_hist, alpha=0, beta=hist_h, norm_type=cv.NORM_MINMAX)
cv.normalize(g_hist, g_hist, alpha=0, beta=hist_h, norm_type=cv.NORM_MINMAX)
cv.normalize(r_hist, r_hist, alpha=0, beta=hist_h, norm_type=cv.NORM_MINMAX)
## [Normalize the result to ( 0, histImage.rows )]

## [Draw for each channel]
for i in range(1, histSize):
    cv.line(histImage, ( bin_w*(i-1), hist_h - int(b_hist[i-1]) ),
            ( bin_w*(i), hist_h - int(b_hist[i]) ),
            ( 255, 0, 0), thickness=2)
    cv.line(histImage, ( bin_w*(i-1), hist_h - int(g_hist[i-1]) ),
            ( bin_w*(i), hist_h - int(g_hist[i]) ),
            ( 0, 255, 0), thickness=2)
    cv.line(histImage, ( bin_w*(i-1), hist_h - int(r_hist[i-1]) ),
            ( bin_w*(i), hist_h - int(r_hist[i]) ),
            ( 0, 0, 255), thickness=2)
## [Draw for each channel]

## [Display]
cv.imshow('Source image', src)
cv.imshow('calcHist Demo', histImage)
cv.waitKey()
未均衡的图片:
进行均衡
from __future__ import print_function
import cv2 as cv
import argparse

## [Load image]
src = cv.imread('D:/lena.jpg')
if src is None:
    print('Could not open or find the image:', args.input)
    exit(0)
## [Load image]

## [Convert to grayscale]
src = cv.cvtColor(src, cv.COLOR_BGR2GRAY)
## [Convert to grayscale]

## [Apply Histogram Equalization]
dst = cv.equalizeHist(src)
## [Apply Histogram Equalization]

## [Display results]
cv.imshow('Source image', src)
cv.imshow('Equalized Image', dst)
## [Display results]

## [Wait until user exits the program]
cv.waitKey()
今天的文章直方图均衡_直方图处理的原理分享到此就结束了,感谢您的阅读,如果确实帮到您,您可以动动手指转发给其他人。
版权声明:本文内容由互联网用户自发贡献,该文观点仅代表作者本人。本站仅提供信息存储空间服务,不拥有所有权,不承担相关法律责任。如发现本站有涉嫌侵权/违法违规的内容, 请发送邮件至 举报,一经查实,本站将立刻删除。
如需转载请保留出处:https://bianchenghao.cn/54222.html


