目录
predict()的用法
函数形式
predict (object, ...)该函数是一个大类,其中还包含很多变体:
[1] predict.ar* predict.Arima* predict.arima0* predict.glm
[5] predict.HoltWinters* predict.lm predict.loess* predict.mlm*
[9] predict.nls* predict.poly* predict.ppr* predict.prcomp*
[13] predict.princomp* predict.smooth.spline* predict.smooth.spline.fit* predict.StructTS*
注意:我们可以直接利用这些变体进行预测,也可以都利用predict()函数,除了参数不一样外,输出结果是一样的。
参数介绍
- object 一个模型对象
- … 额外参数
predict.glm()的用法
函数形式
## S3 method for class 'glm'
predict(object, newdata = NULL,
            type = c("link", "response", "terms"),
            se.fit = FALSE, dispersion = NULL, terms = NULL,
            na.action = na.pass, ...)
参数介绍
- object: 是一个从glm继承的模型对象
- newdata: 是一个数据框,如果缺失就用训练数据进行预测,也即拟合值
- type: 表示预测种类。默认是归一化的线性预测;responses是归一化的响应变量。因此对于一个二分类模型,默认是log-odds (logit归一化的概率),然而type=”response”给出的是预测概率。“terms”返回一个矩阵提供在线性预测下模型公式中每一项的拟合值。
- se.fit: 是一个bool值,表示标准误差是否需要。
- dispersion: GLM中用于计算标准化误差的离差。如果缺失,将会返回模型对象中的summary.
- terms: with
type = "terms"by default all terms are returned. A character vector specifies which terms are to be returned. - na.action: 表示如何对待newdata中的缺失数据,默认是将缺失值预测为NA.
输出介绍
- 如果se.fit=FALSE, 返回一个预测值的向量或者矩阵。如果type=’terms’,返回的是一个矩阵并且有个属性是“constant”.
- 如果se.fit=TRUE, 返回一个list,其中的元素包含
- fit: 预测值,就如se.fit=FALSE
- se.fit: 估计的标准化误差
- residual.scale: 一个常数给出了用于计算标准化误差的散度的平方根。
实例
require(graphics)

## example from Venables and Ripley (2002, pp. 190-2.)
ldose <- rep(0:5, 2)
numdead <- c(1, 4, 9, 13, 18, 20, 0, 2, 6, 10, 12, 16)
sex <- factor(rep(c("M", "F"), c(6, 6)))
SF <- cbind(numdead, numalive = 20-numdead)
budworm.lg <- glm(SF ~ sex*ldose, family = binomial)
summary(budworm.lg)

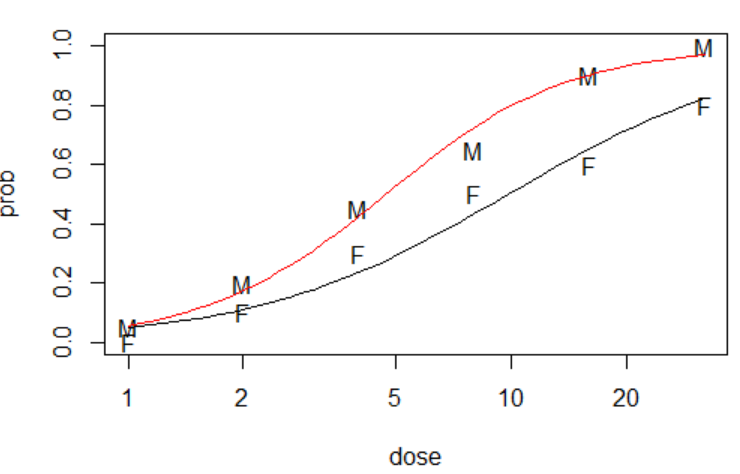
plot(c(1,32), c(0,1), type = "n", xlab = "dose",
     ylab = "prob", log = "x")
text(2^ldose, numdead/20, as.character(sex))
ld <- seq(0, 5, 0.1)

lines(2^ld, predict(budworm.lg, data.frame(ldose = ld,sex = factor(rep("M", length(ld)),         levels = levels(sex))),type = "response"))

lines(2^ld, predict(budworm.lg, data.frame(ldose = ld, sex = factor(rep("F", length(ld)), levels = levels(sex))), type = "response"))

lines(2^ld, predict.glm(budworm.lg, data.frame(ldose = ld,sex = factor(rep("M", length(ld)), levels = levels(sex))),type = "response"),col='red')
注意将predict()换成predict.glm()结果一样
predict.lm()的用法
## S3 method for class 'lm'
predict(object, newdata, se.fit = FALSE, scale = NULL, df = Inf,
        interval = c("none", "confidence", "prediction"),
        level = 0.95, type = c("response", "terms"),
        terms = NULL, na.action = na.pass,
        pred.var = res.var/weights, weights = 1, ...)
参数含义
- object: 这里是lm的对象或者继承类
- interval: 是置信区间的类型。
- level: Tolerance/confidence level.
- pred.var: 未来观测值的方差。
- weights: 用于预测的方差权重,这可是一个数值向量或者单边模型公式。如果是后者,它可以解析为基于newdata的一个运算。
实例
require(graphics)

## Predictions
x <- rnorm(15)
y <- x + rnorm(15)
predict(lm(y ~ x))
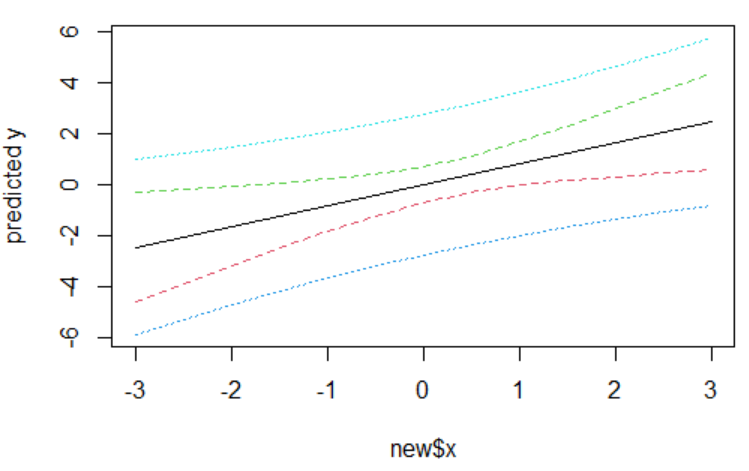
new <- data.frame(x = seq(-3, 3, 0.5))
predict(lm(y ~ x), new, se.fit = TRUE)
pred.w.plim <- predict(lm(y ~ x), new, interval = "prediction")
pred.w.clim <- predict(lm(y ~ x), new, interval = "confidence")
matplot(new$x, cbind(pred.w.clim, pred.w.plim[,-1]),
        lty = c(1,2,2,3,3), type = "l", ylab = "predicted y")

## Prediction intervals, special cases
##  The first three of these throw warnings
w <- 1 + x^2
fit <- lm(y ~ x)
wfit <- lm(y ~ x, weights = w)
predict(fit, interval = "prediction")
predict(wfit, interval = "prediction")
predict(wfit, new, interval = "prediction")
predict(wfit, new, interval = "prediction", weights = (new$x)^2)
predict(wfit, new, interval = "prediction", weights = ~x^2)将predict()换成predict.lm()结果一样
今天的文章R语言中的函数2:predict()分享到此就结束了,感谢您的阅读。
版权声明:本文内容由互联网用户自发贡献,该文观点仅代表作者本人。本站仅提供信息存储空间服务,不拥有所有权,不承担相关法律责任。如发现本站有涉嫌侵权/违法违规的内容, 请发送邮件至 举报,一经查实,本站将立刻删除。
如需转载请保留出处:https://bianchenghao.cn/67238.html


