故障诊断之基于振动信号的阶比谱分析
前言
想写这个帖子很久了,网上关于变速故障诊断的博客,最早应该是发布在我写的一篇知乎的帖子上,里面是基于加拿大渥太华数据进行分析处理的,很好地提取到了轴承的故障特征。后面陆续被一些二道博客贩子,各种加工,拿我的代码和一些截图,随便发了一些水贴,害,也是挺无语的,就想问问他们,到底有没有真正搞懂阶次分析啊?另外就是,之前在CSDN上下载了很多这种代码,看了一下根本没什么太大用处,居然还是收费的,真心不应该为这种“知识付费”,所以后面我会把CSDN上的代码全部免费帖出来,这种东西还要付费,也是够了。
一、阶次分析是什么
在实际工业生产设备工作时,旋转机械很可能不会以恒定转速持续运行,或者存在比较大的转速波动,电机升降速或者调速过程中转速也会处于时刻变化的动态状态。当转速变化时,转动频率也会随之发生变化,轴承、齿轮等故障的特征频率也会随之发生相应变化,此时利用稳态下的FFT分析方法得到的频谱就是无效的,或者如果转速在某一区间内频繁往复波动,在FFT频谱图中就会造成频率重叠甚至难以有效辨识的结果。在信号处理方法的发展历程中,为了克服变转速旋转机械故障诊断中常规FFT等方法失效的问题,学者们开发出阶比分析法,也叫阶比跟踪法。
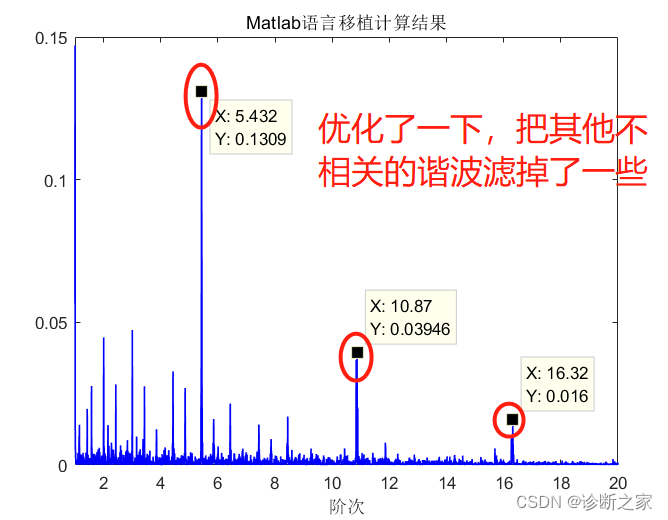
在旋转和往复式机械中,载荷的变动和运动部件的缺陷会引起振动,并相应的辐射噪声。振动的形态与机械运动及静止部件的结构特性有关。阶次分析是一个将频谱及时间历程与旋转部件的RPM关联起来的工具,揭示振动与噪声机理。频谱分析是一种传统的振动信号分析方法,只适用于稳态信号的分析处理。在升、降速过程中,其主要频率成分受发动机转速的影响而不断发生变化,采用传统的频谱方法进行分析时,会产生明显的频率混叠现象。阶次分析是一种有效的非稳态信号分析方法,采用阶次分析法,可以在变转速条件下,有效地提取出轴承、齿轮的故障特征阶次,这是一种很好的办法。
二、阶次分析的基本原理
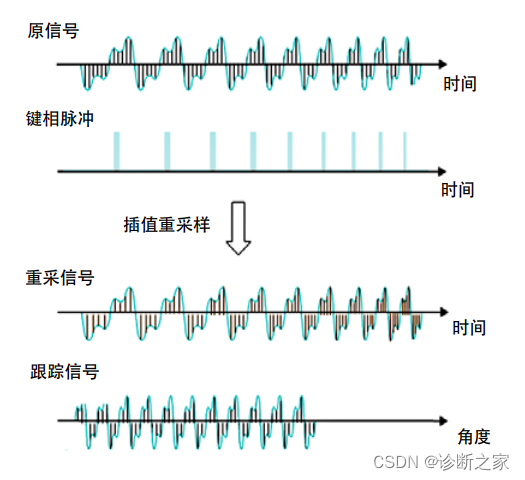
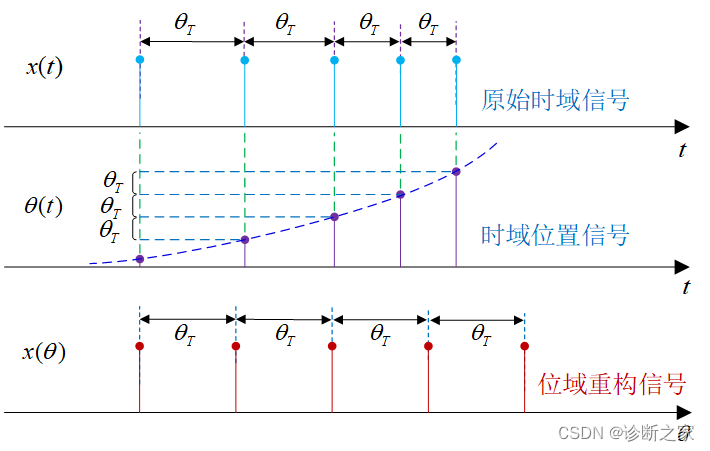
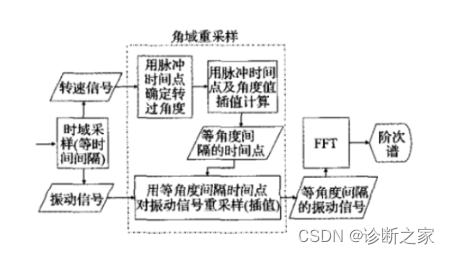
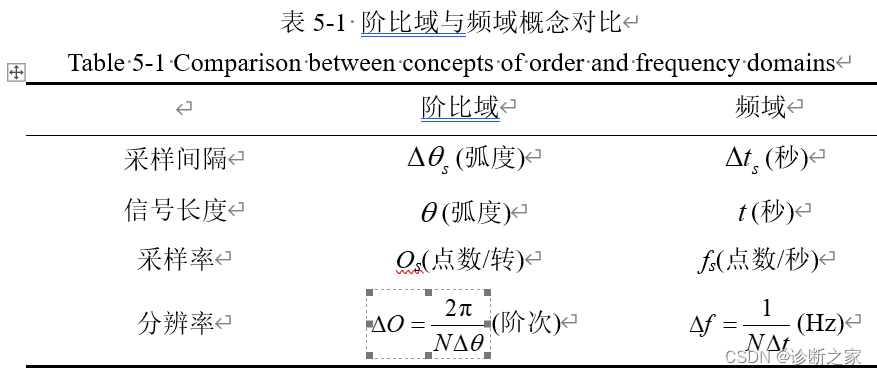
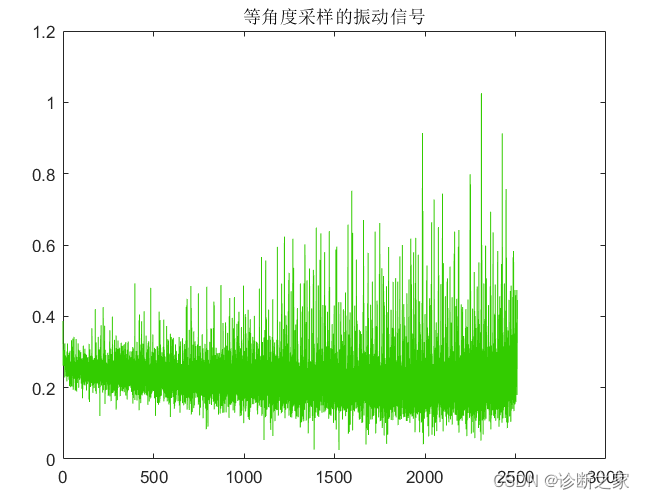
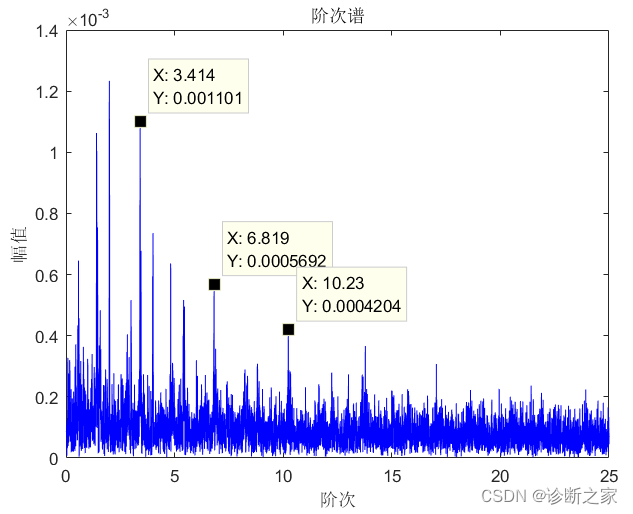
阶次分析方法源于角域采样理论。对于升、降速过程中的非稳态噪声信号,若相对于旋转轴进行恒角度增量采样,则该时域非稳态信号在角度域是稳态信号,再对角度域稳态信号进行FFT变换则可以得到清晰的图谱,即阶次谱。阶次分析的关键是如何实现噪声信号的等角度采样,等角度采样又称阶次采样或阶次追踪。阶次采样时,采样的触发间隔为发动机每转过一定的角度的时间间隔。精确的阶次分析要求对噪声信号进行等角度采样,即采样率的调整要与发动机转速的变化一致,从而保证在发动机转动周期内的采样点数是恒定的。下图所示为阶次采样的实现过程。阶次采样包含两个采样过程。第一个过程是等时间间隔采样过程,在这个过程中,对原始的噪声信号和转速脉冲信号分两路以恒定的采样率进行等时间间隔采样,得到同步采样信号。阶次分析时,为提高采样精度,其等时间间隔采样一般采用过采样技术,即以远远高于奈奎斯特(Nyquist)采样频率的频率对信号进行采样,并辅以适当的数字滤波器,以达到比原AD转换器更高的采样精度。第二个过程是插值重采样过程,其过程是根据转速脉冲序列进行转速估计,然后利用此估计转速计算等角度采样发生的时刻序列,在等角度采样时刻附近的时间区间内对同步采样的原始噪声信号进行插值重采样,从而得到阶次分析所需的角度域稳态信号。
三、基于加拿大渥太华数据进行分析
1.数据下载链接:
加拿大渥太华数据下载
提取码:2l9q
2.数据说明
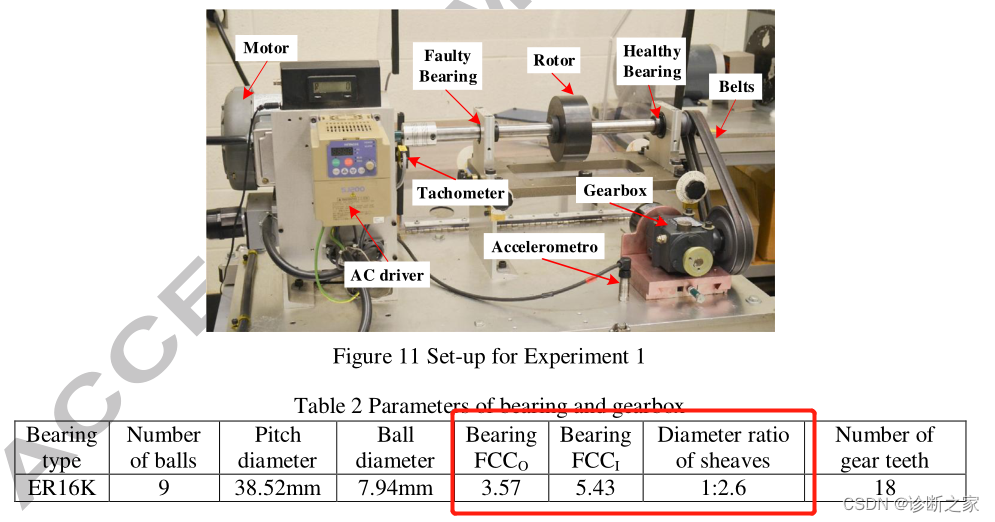
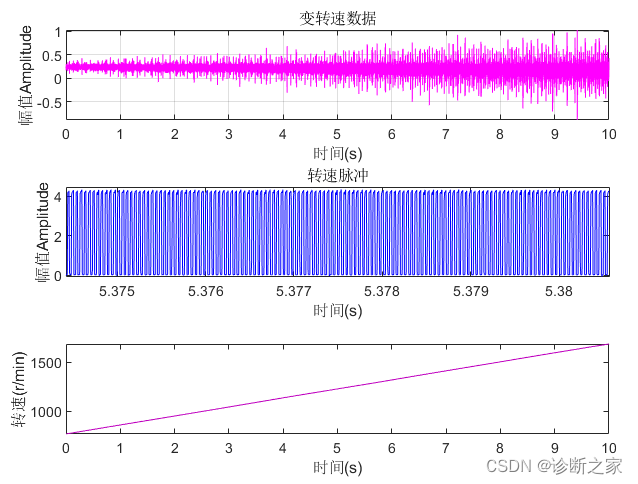
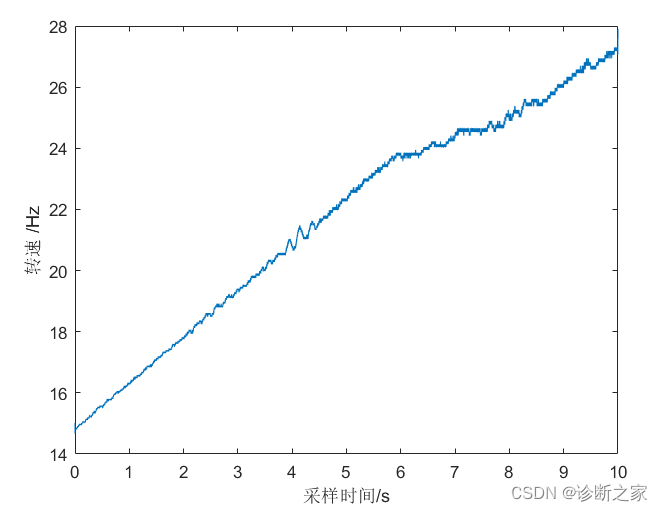
时变转速条件下的轴承振动数据,数据包含在时变转速条件下从不同健康状况的轴承收集的振动信号。共有36个数据集。对于每个数据集,有两个实验设置:轴承健康状况和变速状况。轴承的健康状况包括(i)健康,(ii)有内圈缺陷的故障,以及(iii)有外圈缺陷的故障。工作转速条件是(i)增加速度,(ii)减少速度,(iii)增加然后减少速度,以及(iv)减少然后增加速度。因此,有12种不同的设置情况。为了确保数据的真实性,每个实验设置收集了3个试验,总共得出36个数据集。每个数据集包含两个通道:“ Channel_1” 是加速度计测得的振动数据,“ Channel_2”是编码器测得的转速数据。所有这些数据均以200,000Hz采样,采样持续时间为10秒。
更多详细的数据说明请参考:
故障诊断之基于振动信号的阶比谱分析
四、变速的故障信号仿真模拟
基于MATLAB的变速故障信号仿真代码
五、MATLAB代码分析:
%===========================================
% 更多视频教程:B站关注:诊断之家
% 微信公众号:滚动轴承故障诊断与寿命预测
%               Made by 轴承哥,
% QQ:571485322, 微信:ForwardTszs
%============================================
clc,clear
%读取数据
load('I-A-1.mat');
fs = 200000;
array_time_amp_thief=Channel_1(fs*0+1:fs*10);    %导入时域振动信号
pluse=Channel_2(fs*0+1:fs*10);             %导入脉冲信号
time= 0:1/fs:10-1/fs;  %采集时间为10s
f0 = 12.5;
f1 = 27.8;
subplot(3,1,1)
plot(time,array_time_amp_thief),
title('变转速数据'),
xlabel('时间(s)'),
ylabel('幅值Amplitude');
grid on;
subplot(3,1,2)
plot(time,pluse),
title('转速脉冲'),
xlabel('时间(s)'),
ylabel('幅值Amplitude');
rpm = tachorpm(pluse,fs)/1000;
subplot(3,1,3)
 plot(time,rpm)
 xlabel('时间(s)'),
ylabel('转速(r/min)')
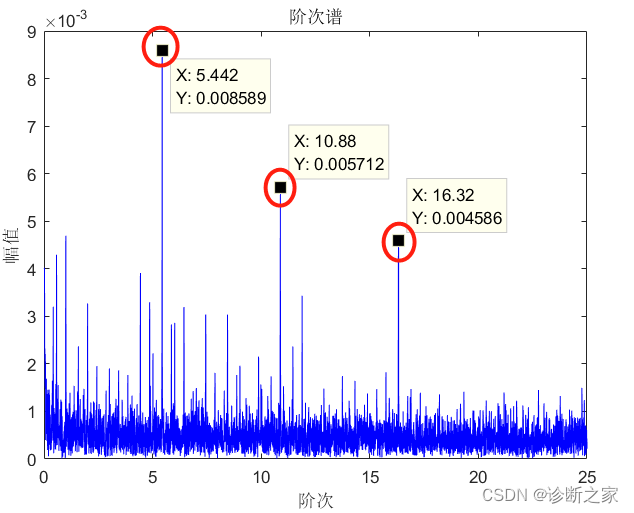
##以外圈故障为例分析:
六、相关代码
function sw = checksw
% CHECKSW  Check if running MATLAB or GNU/Octave
%       sw = checksw
%
%       sw      'MATLAB' or 'OCTAVE' depending on what software checksw is
%               called from. 0 is returned if neither MATLAB or Octave was
%               found (unexpected).
%

% Copyright (c) 2009-2011 by Anders Brandt
% Email: abra@iti.sdu.dk
% Version: 1.0 2011-06-23
% This file is part of ABRAVIBE Toolbox for NVA

v=ver;

sw=0;
for n = 1:length(v)
    Name=v(n).Name;
    if strcmp(upper(Name),'MATLAB')
        sw='MATLAB';
    elseif strcmp(upper(Name),'OCTAVE')
        sw='OCTAVE';
    end
end
function[omega,accfdat,proxfdat,static]=ordtrack(fsamp,keyfsamp,keytdat,acctdat,proxtdat,no_cycles,limits)
% ORDTRACK Order tracking
%         [OMEGA,ACCFDAT,PROXFDAT,STATIC]=ORDTRACK(FSAMP,KEYFSAMP,KEYTDAT,...
%					ACCTDAT,PROXTDAT,NO_CYCLES,LIMITS);
%         returns OMEGA, the running speed in rad/s, ACCFDAT and PROXFDAT,
%         the tracked accelerometer and proximitor data and STATIC, the
%         static proximitor data given:
%         FSAMP, KEYFSAMP     - data and keyphasor sampling rates (Hz)
%         KEYTDAT             - keyphasor time data
%         ACCTDAT,PROXTDAT    - accelerometer and proximitor time data
%         NO_CYCLES           - no of cycles over which to average data (default 8). The higher
%                               the number, the smoother the data (but also the more information
%                               is lost.)
%         LIMITS              - [f1,f2], the speeds (in Hz) over which the tracking is
%                               to be done (default all data);

[pulses,spd,time]=shaftspd(keytdat,keyfsamp);

if ~exist('no_cycles')
 no_cycles=[];
end

if isempty(no_cycles)
 no_cycles=8;
end

p=fix(pulses/(keyfsamp/fsamp)); % index of pulses in data channels
l=max([size(acctdat,1) size(proxtdat,1)]);
time=(0:l-1)'/fsamp;

if ~exist('limits')
 limits=[];
end

if isempty(limits)
 x(1)=time(1);
 x(2)=time(end);
else
 x(1)=limits(1);
 x(2)=limits(2);
end
x=sort(x);
time_at_pulses=pulses/fsamp;
[val,x(1)]=min(abs(time_at_pulses-x(1)));
[val,x(2)]=min(abs(time_at_pulses-x(2)));

l1=pulses(x(1));
l2=pulses(x(2));
ll1=fix(l1/(keyfsamp/fsamp));
ll2=fix(l2/(keyfsamp/fsamp));
pp=polyfit(time_at_pulses(x(1):x(2)),spd(x(1):x(2)),2);
fitspd=polyval(pp,time(ll1:ll2));
fitspd_pulses=p(x(1):x(2))-p(x(1))+1;

if ~exist('no_cycles')
 disp('Finding pulses for frequency spacing');
 [si,ei]=freqspac(fitspd_pulses,fitspd,64,0,res);
else
 si=fitspd_pulses(1:no_cycles:length(fitspd_pulses)-no_cycles);
 ei=fitspd_pulses(no_cycles+1:no_cycles:length(fitspd_pulses));
end

accfdat=[];
proxfdat=[];
static=[];

if ~isempty(proxtdat)
 proxfdat=zeros(length(si),size(proxtdat,2));
 for ii=1:size(proxtdat,2)
  [freqdat,omega,st]=sinefit(proxtdat(ll1:ll2),time(ll1:ll2),fitspd,si,ei);
  proxfdat(:,ii)=freqdat;
  static(:,ii)=st;
 end
end

if ~isempty(acctdat);
 accfdat=zeros(length(si),size(acctdat,2));
 for ii=1:size(acctdat,2)
%   chno=acc_channels(ii);
  [freqdat,omega]=sinefit(acctdat(ll1:ll2),time(ll1:ll2),fitspd,si,ei);
  accfdat(:,ii)=freqdat;
 end
end
function [rpm,t] = tacho2rpm(x,fs,TLevel,Slope,PPR,NewFs,FilterL)
% TACHO2RPM     Extract rpm/time profile from tacho time signal
%       [rpm,trpm] = tacho2rpm(x,fs,TLevel,Slope,PPR)
%
%       rpm         Instanteneous rpm
%       t           Time axis for rpm
%
%       x           Tacho time signal
%       fs          Sampling frequency (in Hz) for x
%       TLevel      Trigger level
%       Slope       +1, or -1 for positive and negative slope, respectively
%       PPR         Number of pulses per revolution for tacho signal
%       NewFs       (optional) sampling frequency for rpm. Default is fs
%       FilterL     Length of smoothing filter, Default is 5 pulses
%
% See also
%

% Copyright (c) 2009-2011 by Anders Brandt
% Email: abra@iti.sdu.dk
% Version: 1.0 2011-06-23
%          1.1 2012-01-15 Modified to work in Octave
% This file is part of ABRAVIBE Toolbox for NVA

% Parse inputs
if nargin == 5
    NewFs = fs;
    FilterL=5;
elseif nargin == 6
    FilterL=5;
elseif nargin < 7
    error('Wrong number of input parameters')
end

% Define time axis for tacho signal
t=makexaxis(x,1/fs);

% Get trigger times
xDiff=diff(sign(x-TLevel));     % Produces +/- 2 where trigger event
tDiff=t(2:end);                 % Diff shifts one sample
if Slope > 0
    tTacho=tDiff(find(xDiff == 2));    % Tacho trigger positive slope instances
else
    tTacho=tDiff(find(xDiff == -2));   % Tacho trigger negative slope instances
end

% Calculate rpm from time between tacho pulses. Assign rpm to second tacho
% pulse of each pair
rpmt=60/PPR./diff(tTacho);              % Instantaneous rpm values
% Average each pair of rpm estimates and put on time of middle tacho pulse
rpmt=0.5*(rpmt(1:end-1)+rpmt(2:end));
tTacho=(tTacho(2:end-1));               % diff shifted one sample

% Smooth to obtain more stable values
if FilterL > 1
    a=1;
    b=1/FilterL*ones(1,FilterL);
    if strcmp(checksw,'MATLAB')
        rpmt=filtfilt(b,a,rpmt);
    else                            % Octave filtfilt does not work
        rpmt=filter(b,a,rpmt);
    end
end


% Interpolate to NewFs resolution
t=(0:1/NewFs:t(end))';
rpm=interp1(tTacho,rpmt,t,'linear','extrap');
参考文献
[1] Shufeng Ai. Research on Order Tracking and Teager-Huang Transform Based Gear Crack Fault Diagnosis[C]. 2011 Second International Conference on Mechanic Automation and Control Engineering, Hohhot, 2011: 6041-6044.
[2] Z. Xiaofeng, S. Haibo and S. Wenli. An Implementation Method for the Transmission Fault Diagnosis Based on Order Tracking[C]. 2012 IEEE International Conference on Computer Science and Automation Engineering (CSAE), Zhangjiajie, 2012: 312-315.
[3] J. Hong, W. Guangrui, Z. Xiangfeng, et al. Application of Spectral Kurtosis and Vold-Kalman Filter Based Order Tracking in Wind Turbine Gearbox Fault Diagnosis[C]. 2017 9th International Conference on Modelling, Identification and Control (ICMIC), Kunming, 2017: 49-53.
今天的文章振动信号阶次分析教程_振动信号处理与数据分析分享到此就结束了,感谢您的阅读。
版权声明:本文内容由互联网用户自发贡献,该文观点仅代表作者本人。本站仅提供信息存储空间服务,不拥有所有权,不承担相关法律责任。如发现本站有涉嫌侵权/违法违规的内容, 请发送邮件至 举报,一经查实,本站将立刻删除。
如需转载请保留出处:https://bianchenghao.cn/88464.html

